This is the solution to Homework 6: Problems - MATLAB data analysis and optimization.
♣ Due Date: Wednesday Dec 13, 2017 9:00 AM. This homework aims at giving you some experience with image and data analysis and optimization techniques in MATLAB. For this homework, you need to only return two problems of your own choice, out of the three questions. The extra question, if you answer it, will be considered as an extra credit.
1. Subplots in MATLAB. Consider this MATLAB data file data3D.mat which contains a 3-dimensional $41\times 61\times 16$ matrix of the brain of a rat. Write a MATLAB script that creates and saves a graph of all $X-Y$ information for the 16 slices along the z axis like the following.
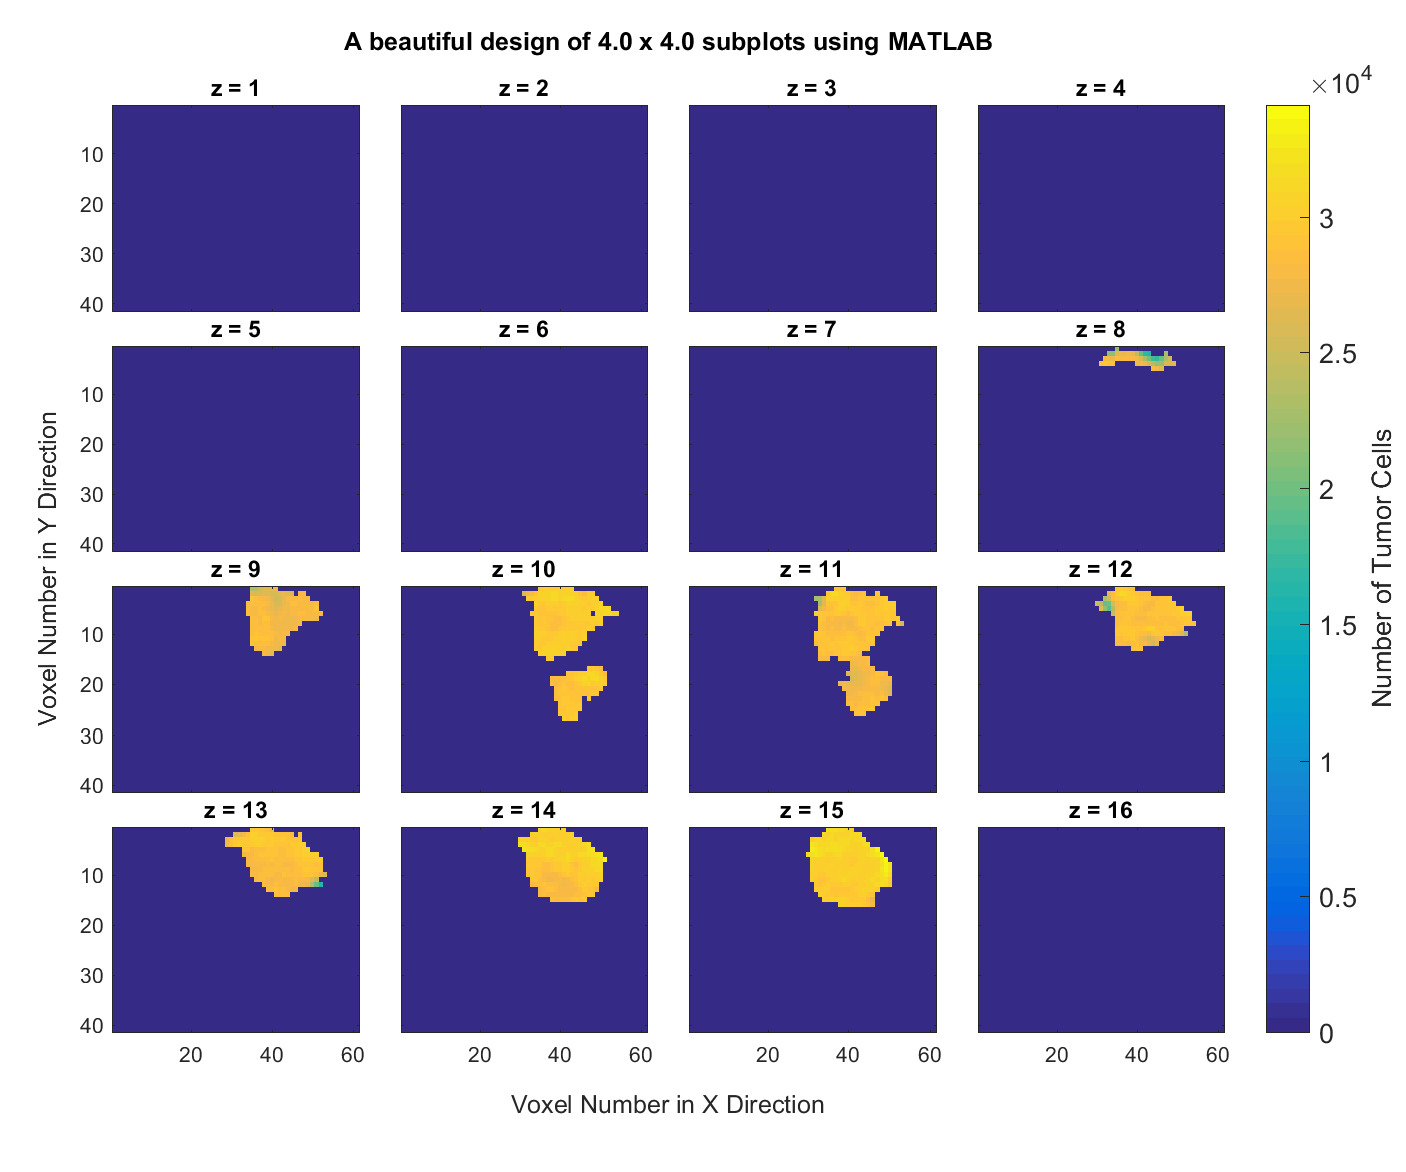
Hint: Start from this MATLAB script that I have written for you. Play with all the options to understand what they do and see their effects on the resulting plot. This script should generate the following figure for you.
Answer:
Here is an implementation of this code: makeSubplots.m.
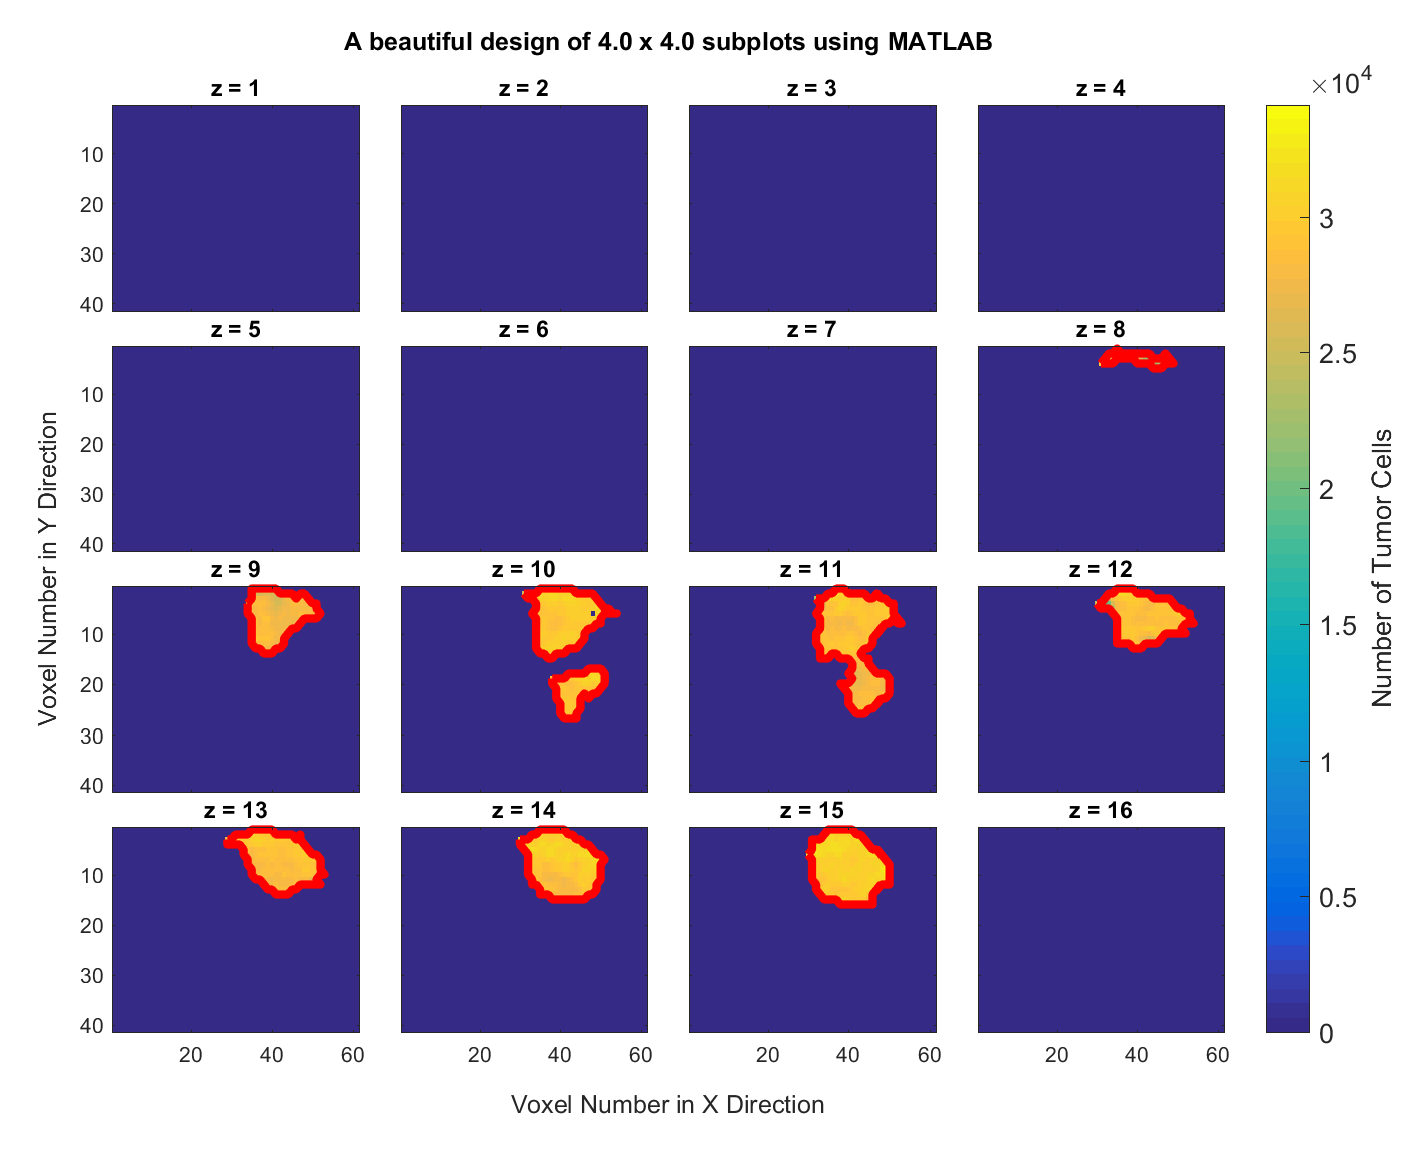
2. Getting the boundary of objects in images.. Consider the same dataset as in the previous problem. Write a MATLAB script that delineates the boundary of the tumor in all of the subplots and generates a figure with the tumor boundary highlighted, like the following graph.
Answer:
Here is an implementation of this code: makeSubplotsWithTumorBoundary.m.
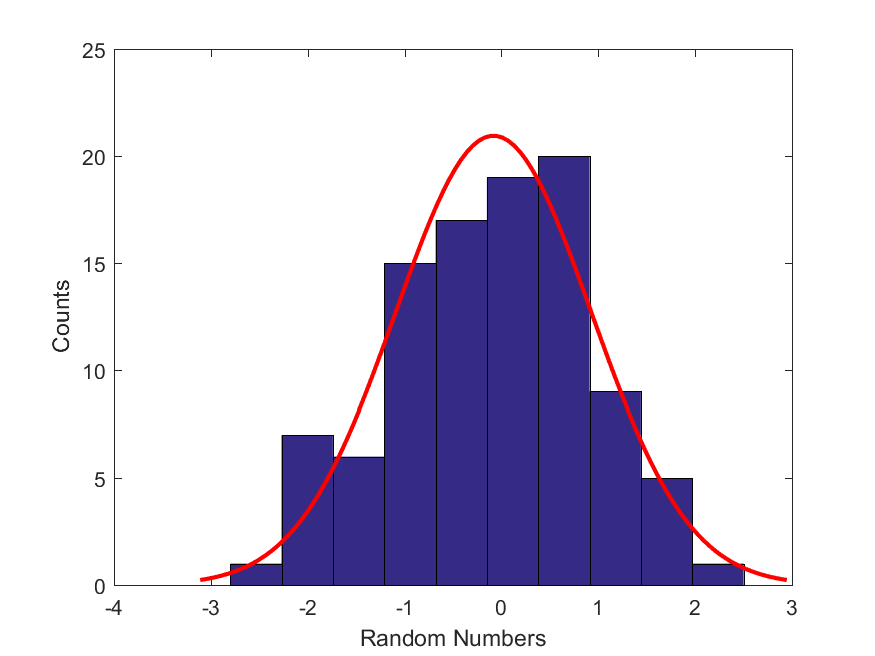
3. Regression: obtaining the most likely mean and standard deviation of a set of Standard Normally Distributed Random Variables. Consider this dataset, Drand.mat, which contains a set of random numbers. Let’s make a hypothesis with regards to this dataset: We assume that this dataset is well fit by a Gaussian distribution. But, we don’t know the values of the two parameters (mean and standard deviation) of this Normal (Gaussian) distribution. Therefore, write a MATLAB script that constructs an objective function (similar to what we are planning to do for the mathematical modeling section of the project) and then uses MATLAB’s built-in function, fminsearch(), to find the most likely values of the mean and standard deviation of this Gaussian distribution. Here is a best-fit Gaussian distribution using the most likely parameters to the histogram of this dataset.
Hints: Our hypothesis is that the data in this histogram comes from a standard Normal distribution with a fixed mean ($\mu$) and standard deviation ($\sigma$). For the moment, let’s assume that we know the values of these two parameters. Then if all of these points, $D$, come from the normal distribution with the given $(\mu,\sigma)$, then the probability of all them coming from the normal distribution with these parameter values can be computed as,
where the symbol $\pi$ to the left of equality means probability (but note that $\pi$ on the right hand side of the euqation stands for the number $\pi=3.14\ldots$, and $D(i)$ refers to the $i$th point in the sample of points. Since probabilities are always extremely small numbers, it is always good to work with their log() values instead of their raw values (can you guess why?). Therefore, we could take the log of the above equation to write it as,
Now our goad is to construct this function (let’s name it getLogProbNorm()) and pass it to MATLAB’s built-in function fminsearch() in order to find the most likely $(\mu,\sigma)$ that leads to the highest likelihood value (the maximum of the above equation). Here is one last tip: Note that fminsearch() minimizes functions, but we want to maximize getLogProbNorm(), instead of minimizing it. What change could you make to this function to make it work with fminsearch()? Name your main script findBestFitParameters.m. Now when you run your script it should call fminsearch() and then output the best-fit parameters like the following,
>> findBestFitParameters
mu: -0.082001 , sigma: 1.0043
Start your parameter search via fminsearch() with the following values: $[\mu,\sigma] = [1,10]$.
Answer:
Here is an implementation of this code: findBestFitParameters.m.