Consider this dataset points.txt. Write a script that reads this dataset and plots the second column of the dataset versus the first column as the following,

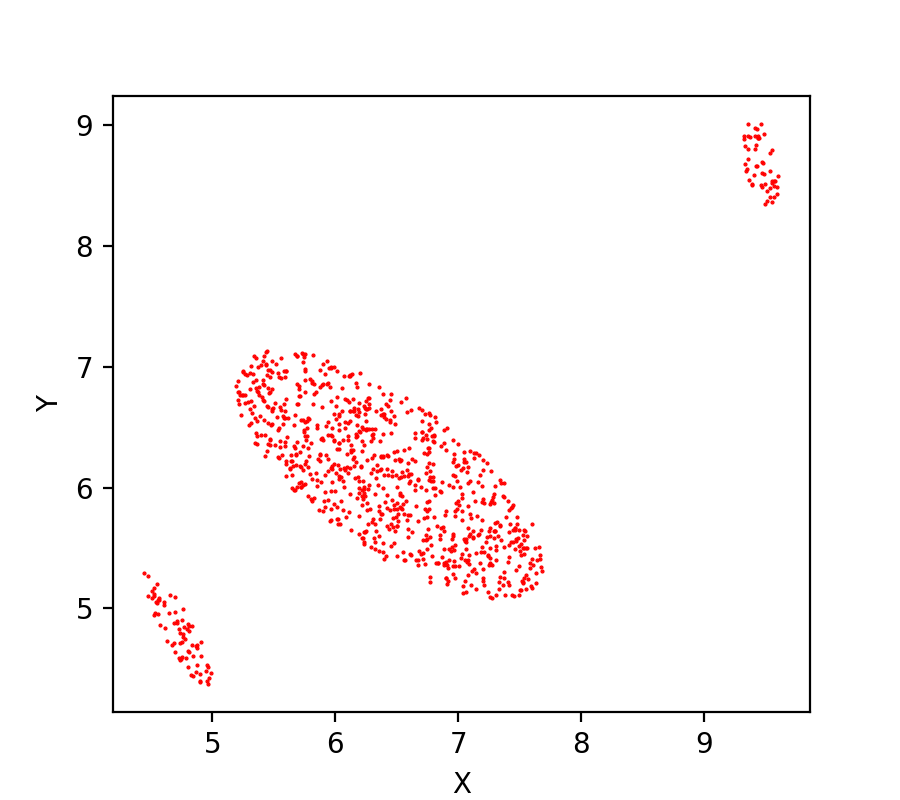
Now write another script that applies Kmeans clustering technique to this data set with an input number of clusters equal to 3.
%matplotlib notebook
import matplotlib.pyplot as plt
import pandas as pd
# read data
Data = pd.read_csv("points.txt")
fig = plt.figure( figsize=(4.5, 4) \
, dpi= 200 \
, facecolor='w' \
, edgecolor='w' \
) # create figure object
ax = fig.add_subplot(1,1,1) # Get the axes instance
ax.plot( Data.x \
, Data.y \
, 'r.' \
, markersize = 1 \
) # plot with color red, as points
ax.set_xlabel('X')
ax.set_ylabel('Y')
fig.savefig('points.png', dpi=200) # save the figure to an external file
plt.show() # display the figure
%matplotlib notebook
import numpy as np
import matplotlib.pyplot as plt
import pandas as pd
from sklearn.cluster import KMeans
# read data
Data = pd.read_csv("points.txt")
Point = np.array(np.transpose([Data.x,Data.y]))
PointClusterID = KMeans ( n_clusters = 3 \
, random_state = 344 \
, init = "k-means++" \
, n_init = 100 \
, max_iter = 300 \
, tol = 0.001 \
).fit_predict(Point)
fig = plt.figure()
ax = fig.add_subplot(1,1,1) # Get the axes instance
plt.scatter ( Point[:, 0] \
, Point[:, 1] \
, c = PointClusterID \
, s = 1 \
)
fig.savefig('clusters3.png', dpi=200) # save the figure to an external file
