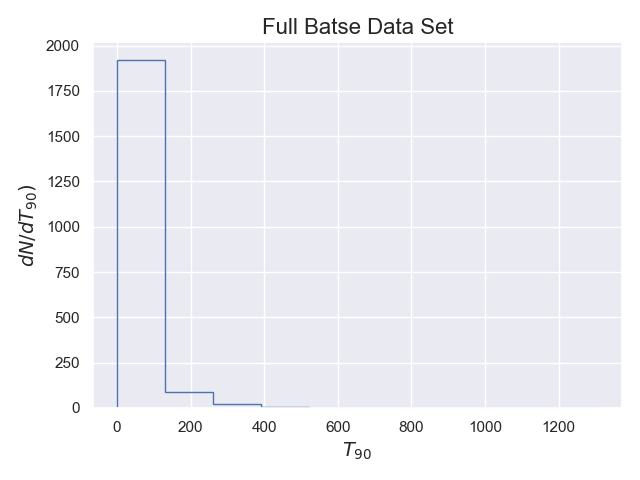
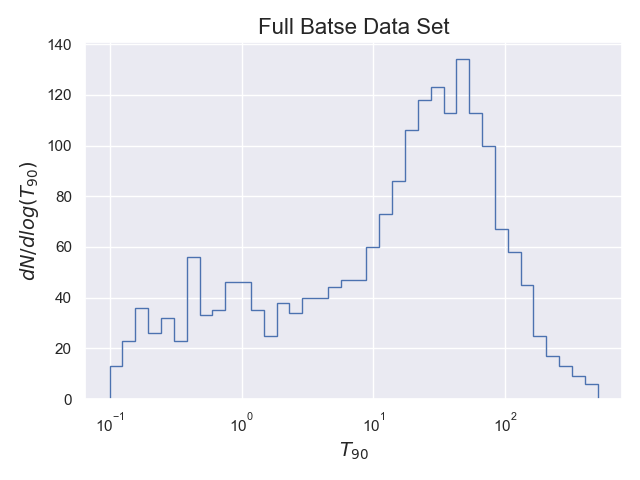
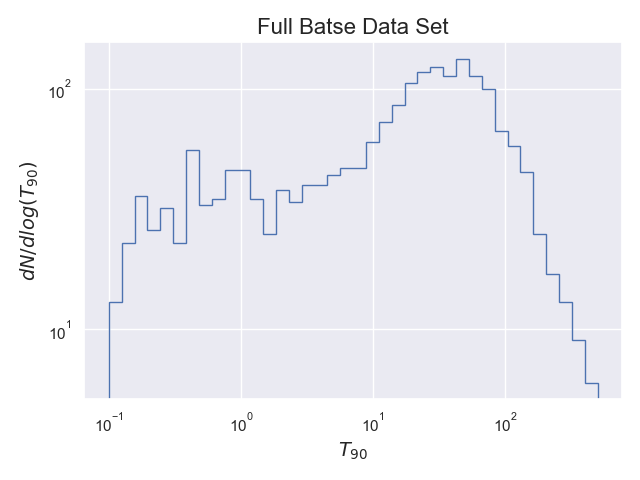
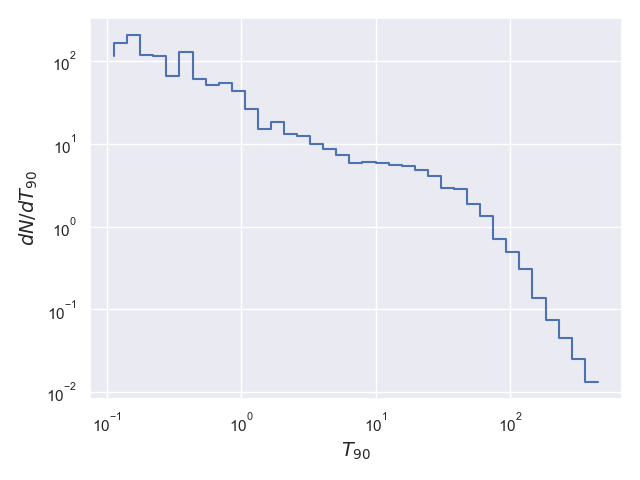
Consider this CSV dataset containing the durations of a set of astrophysical events (T50 and T90), their corresponding 1-sigma uncertainties (T590err, T90err), the event IDs (Trigger) and the starting time of the events (T90Start) with respect to some reference time point. Read this data and make histograms of the duration distributions as measured by the column T90, which is reported in seconds, like the following plots. Explain the differences between the plots?