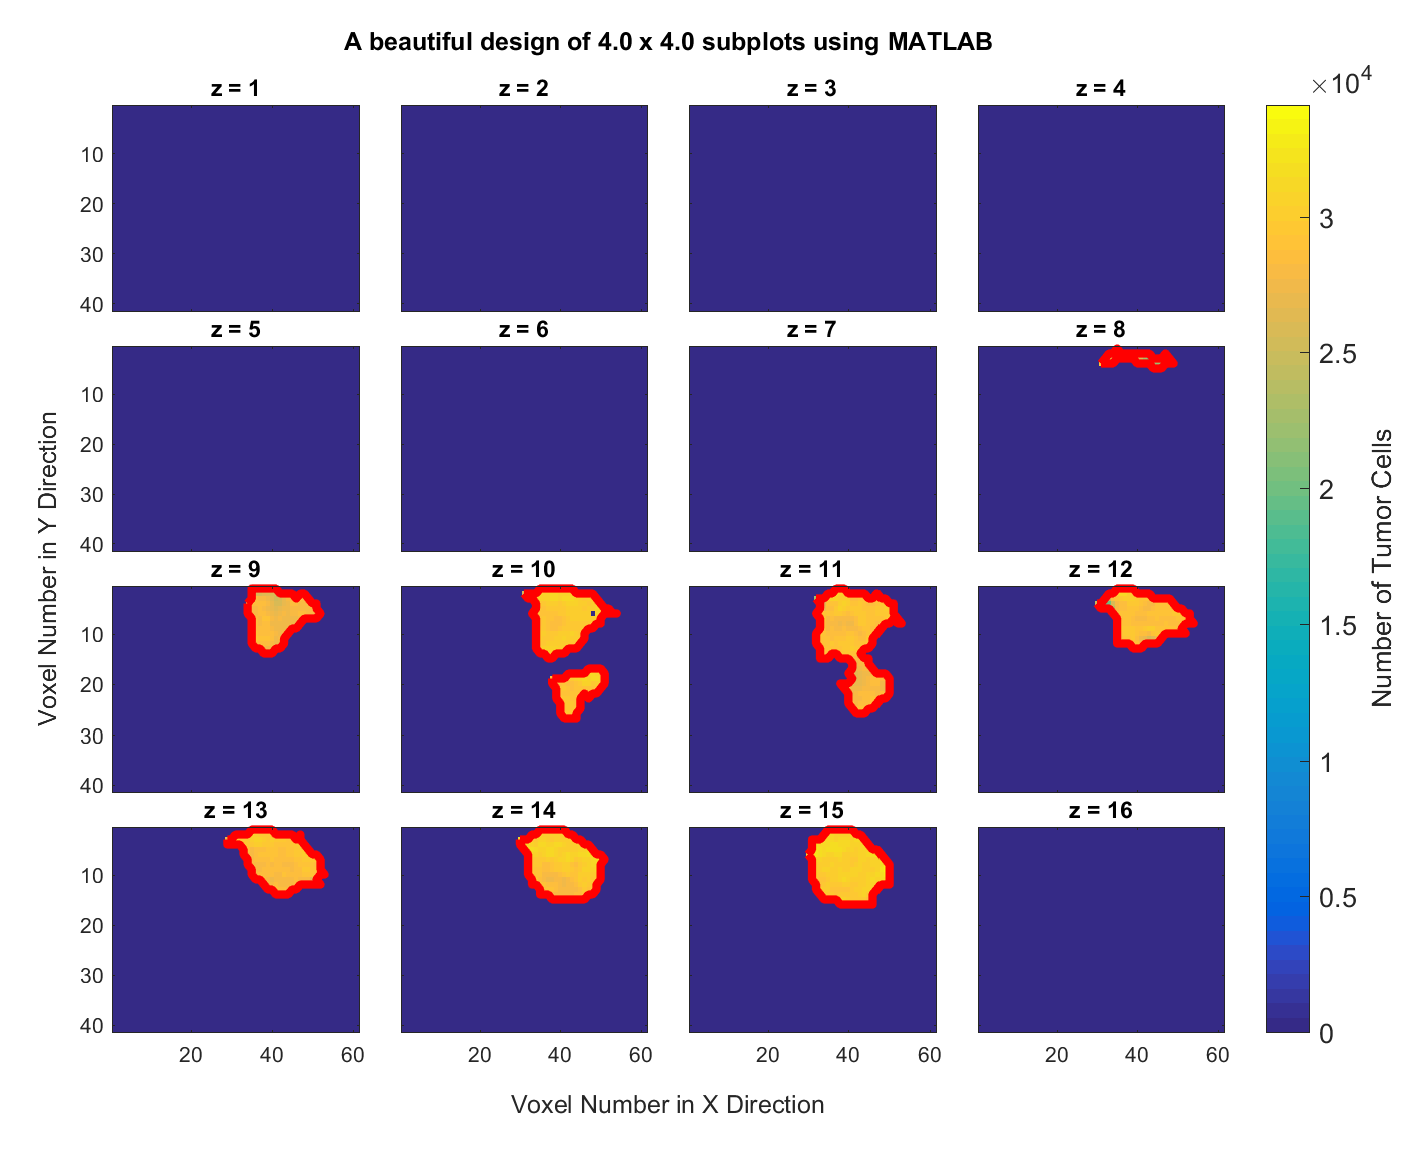
Consider this MATLAB data file data3D.mat which contains a 3-dimensional $41\times 61\times 16$ matrix of the brain of a rat. Write a MATLAB script that creates and saves a graph of all $X-Y$ information for the 16 slices along the z-axis and delineates the boundary of the tumor in all of the subplots and generates a figure with the tumor boundary highlighted, like the following graph,