Supposed we have observed a dataset comprised of $4975$ events with two attributes variable1 and variable2 points in this file: data.csv. Plotting these points would yield a scatter plot like the red points in the following plot,
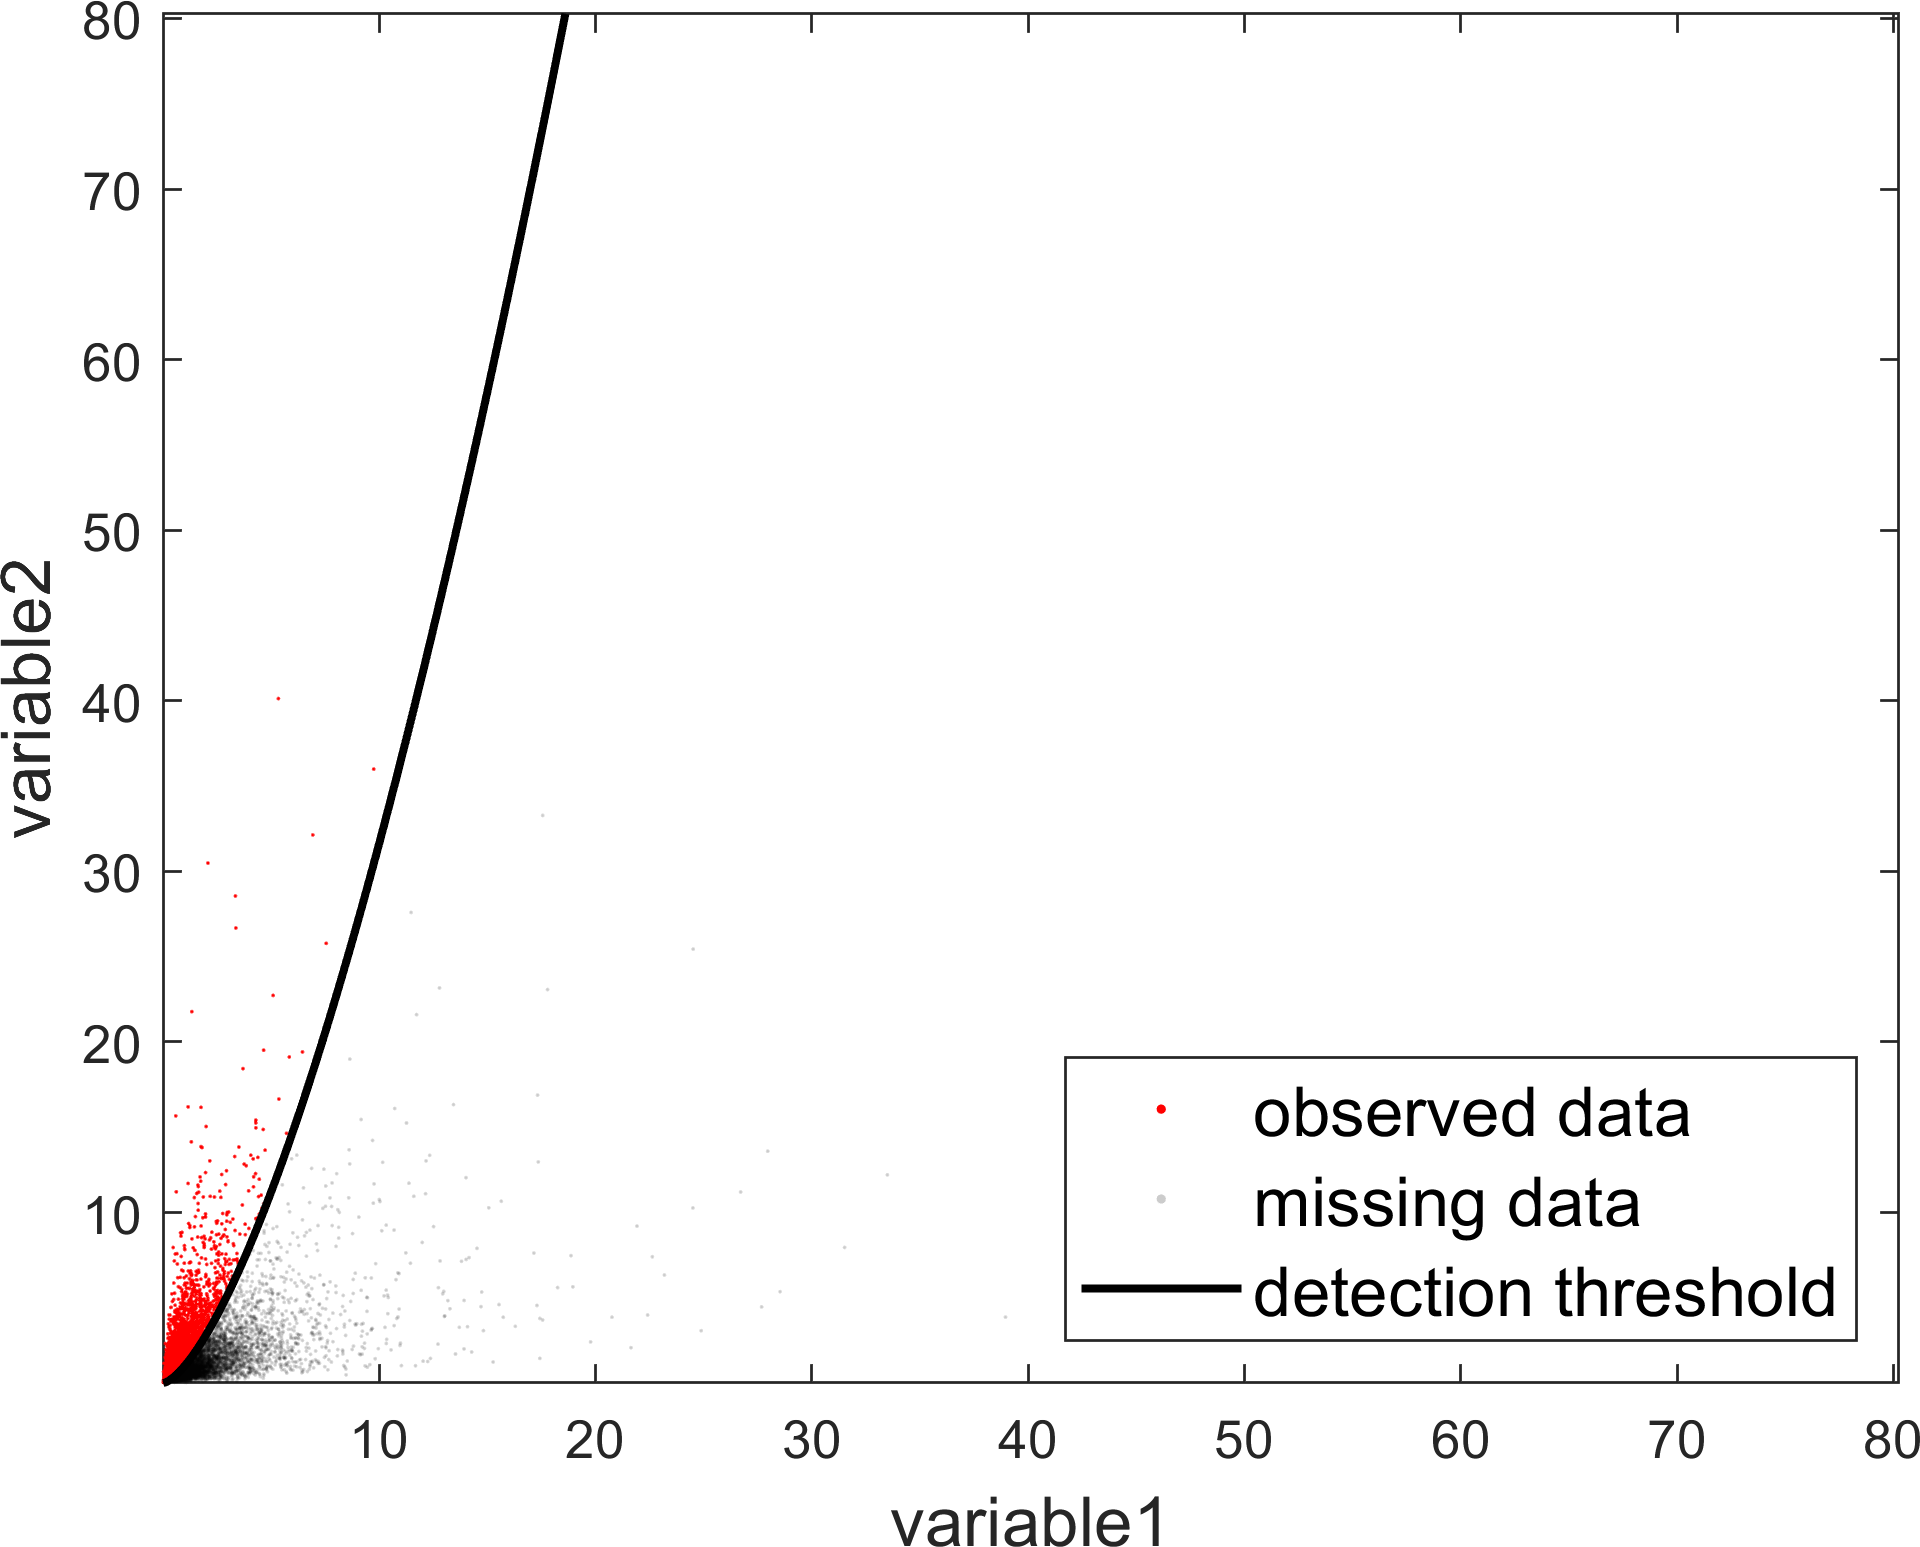
The pale black point represent the missing points from our observational dataset. These are points that we could observe (or detect) because of some instrumental bias and sample incompleteness as represented by the black line.
Now our goal is to form a hypothesis about this dataset, that is, a hypothesis about the joint distribution of the events in the above plot and the correlation between the two variables. To make a correct assessment, we will have to also carefully consider the effects of the detection threshold (the black line) in our inference.
To help you get started, we can first take the logarithm of this dataset to better understand the joint distribution of the two attributes of the dataset and plot the transformed data,
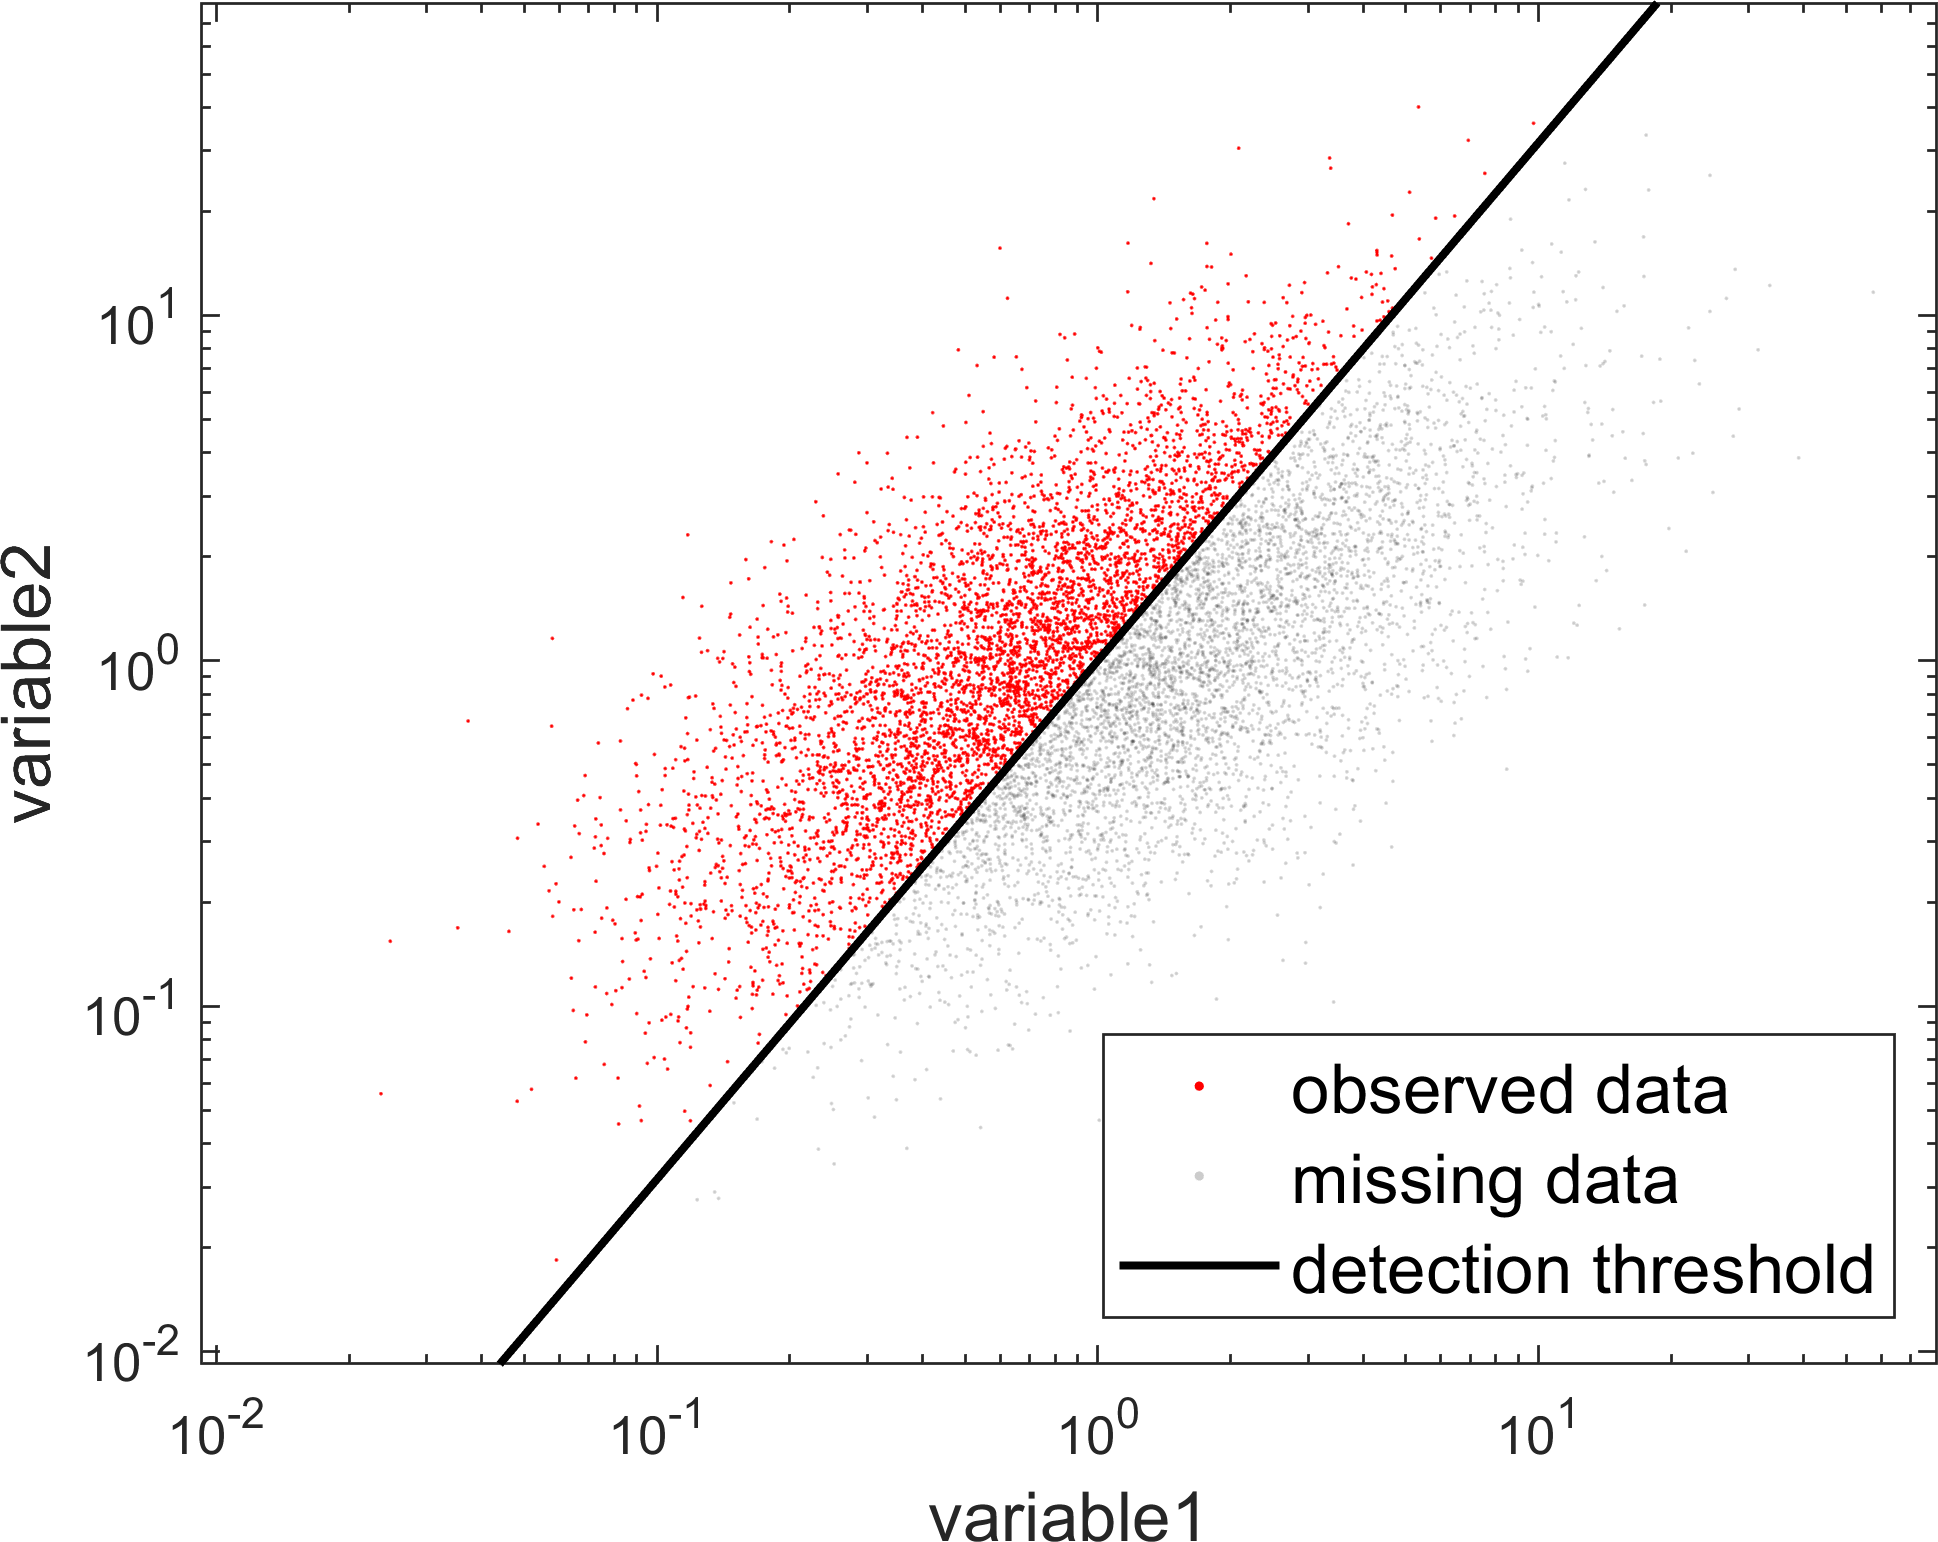
Just by looking at the observed (red) data points, we can form a relatively good hypothesis about the joint distribution of the data: If the detection threshold did not exist, the complete dataset (including the black points) would have likely very well resembled a bivariate lognormal distribution (or a bivariate normal distribution on the logarithmic axes).
However, this dataset is affected by the detection threshold and we need to also take a model of the detection threshold into account. The logarithmic transformation makes it crystal-clear to us that the detection threshold is likely best modeled by a power-law (or simply a line in the log-space as depicted in the above figure).
Use the ParaMonte library from the language of your choice (e.g., Python/MATLAB) to perform a Markov Chain Monte Carlo simulation for this regression problem and find the true amount of correlation between the two attributes of this dataset, that is, after taking into account the effects of the detector threshold.
Hint:
You can use the ParaMonte library in Python or in MATLAB to perform the Monte Carlo simulation.
