Supposed we have observed a dataset comprised of $15027$ events with one attribute variable in this file: dataFull.csv. Plotting these points would yield a histogram like the following plot,
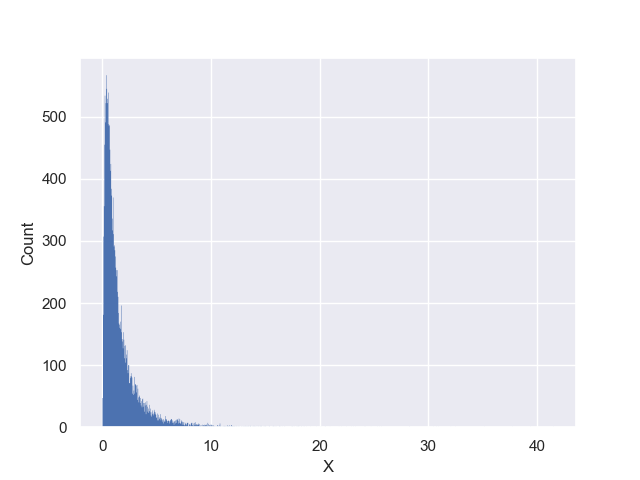
Now our goal is to form a hypothesis about this dataset, that is, a hypothesis about the distribution of the events in the above plot.
To help you get started, we can first take the logarithm of this dataset to better understand the distribution of the attribute of the dataset and plot the transformed data,
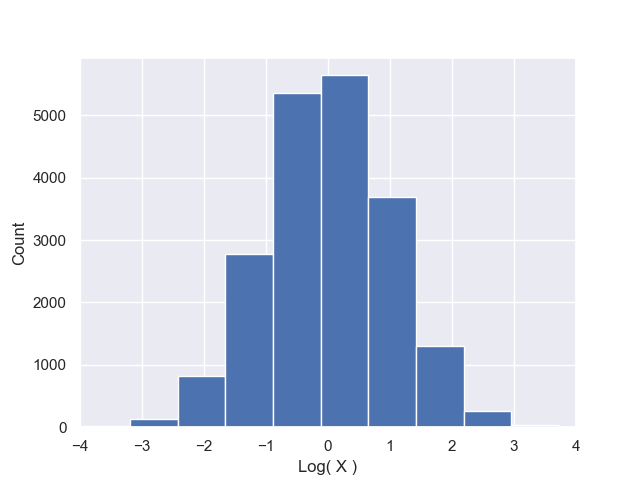
Just by looking at the observed (red) distribution, we can form a relatively good hypothesis about the distribution of the data: This dataset is likely very well fit by a log-normal distribution, that is, the log-transform of data is very well fit by a Normal distribution.
Now, use the maximum likelihood method to infer the two unknown parameters of the corresponding Normal distribution that best fits the log-transformed data.
Hint:
- First read the data using Pandas library, then log-transform data to make it look like a Normal distribution.
-
Write a class that takes the log-data as input and has two methods,
getLogProb(data,avg,std)andgetLogLike(param). The former computes the log-probability of observing the input datasetdatagiven the parameters of the model (the Normal averageavgand the Normal standard deviationstd). The latter method takes a set of parameters as a vector containing the average of the Normal distribution (avg) and the natural-logarithm of the standard deviation of the Normal distributionlog(std). Given these two parameters,getLogLike(param)sums over the log-probabilities returned bygetLogProb(data,avg,std)to compute the log-likelihood and returns it as the output. - You can use
scipy.optimize.fminto perform the maximization of log-likelihood to obtain the best-fit parameters. Once done with the minimization (of negative log-likelihood), report the best-fit parameters on the display.
