Supposed we have observed a dataset comprised of events with one attribute as in this file: z.csv. Plotting these points would yield a histogram like the following plot,
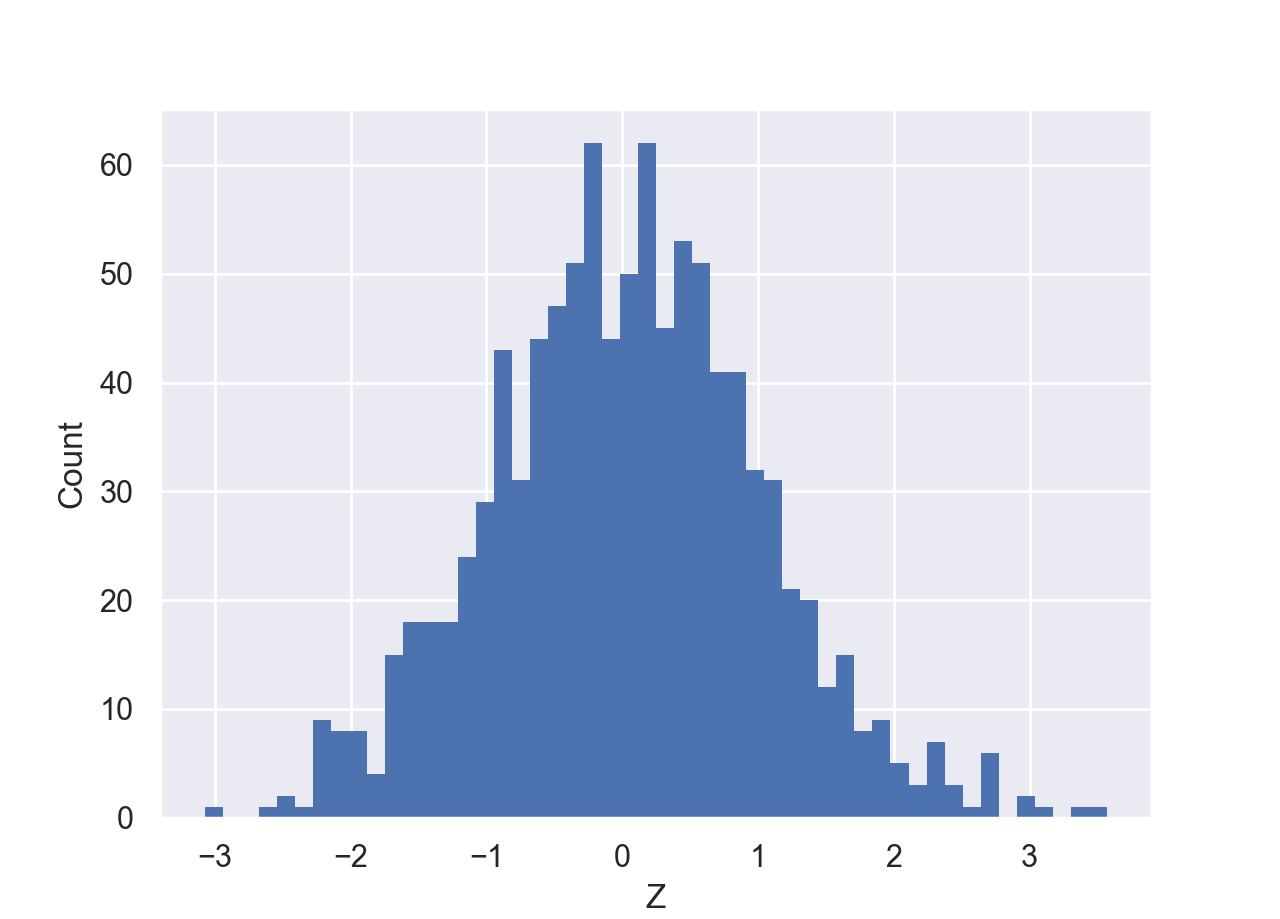
Now our goal is to form a hypothesis about this dataset, that is, a hypothesis about the distribution of the events in the above plot. Just by looking at the observed distribution, we can form a relatively good hypothesis about the distribution of the data: This dataset is likely very well fit by a Normal distribution.
Now, use the maximum likelihood method to infer the two unknown parameters of the Normal distribution that best fits the data.
Hint:
- First read the data using Pandas library.
- Write a function/class that takes the data as input and has two methods,
getLogProb(data,avg,std)andgetLogLike(param). The former computes the log-probability of observing the input datasetdatagiven the parameters of the model (the Normal averageavgand the Normal standard deviationstd). The latter method takes a set of parameters as a vector containing the average of the Normal distribution (avg) and the natural-logarithm of the standard deviation of the Normal distributionlog(std). Given these two parameters,getLogLike(param)sums over the log-probabilities returned bygetLogProb(data,avg,std)to compute the log-likelihood and returns it as the output. - You can use
scipy.optimize.fminto perform the maximization of log-likelihood to obtain the best-fit parameters. Once done with the minimization (of negative log-likelihood), report the best-fit parameters on the display. - Now, consider the following more complicated problem with this data xy.csv. Visualizing this dataset gives us the following plot.
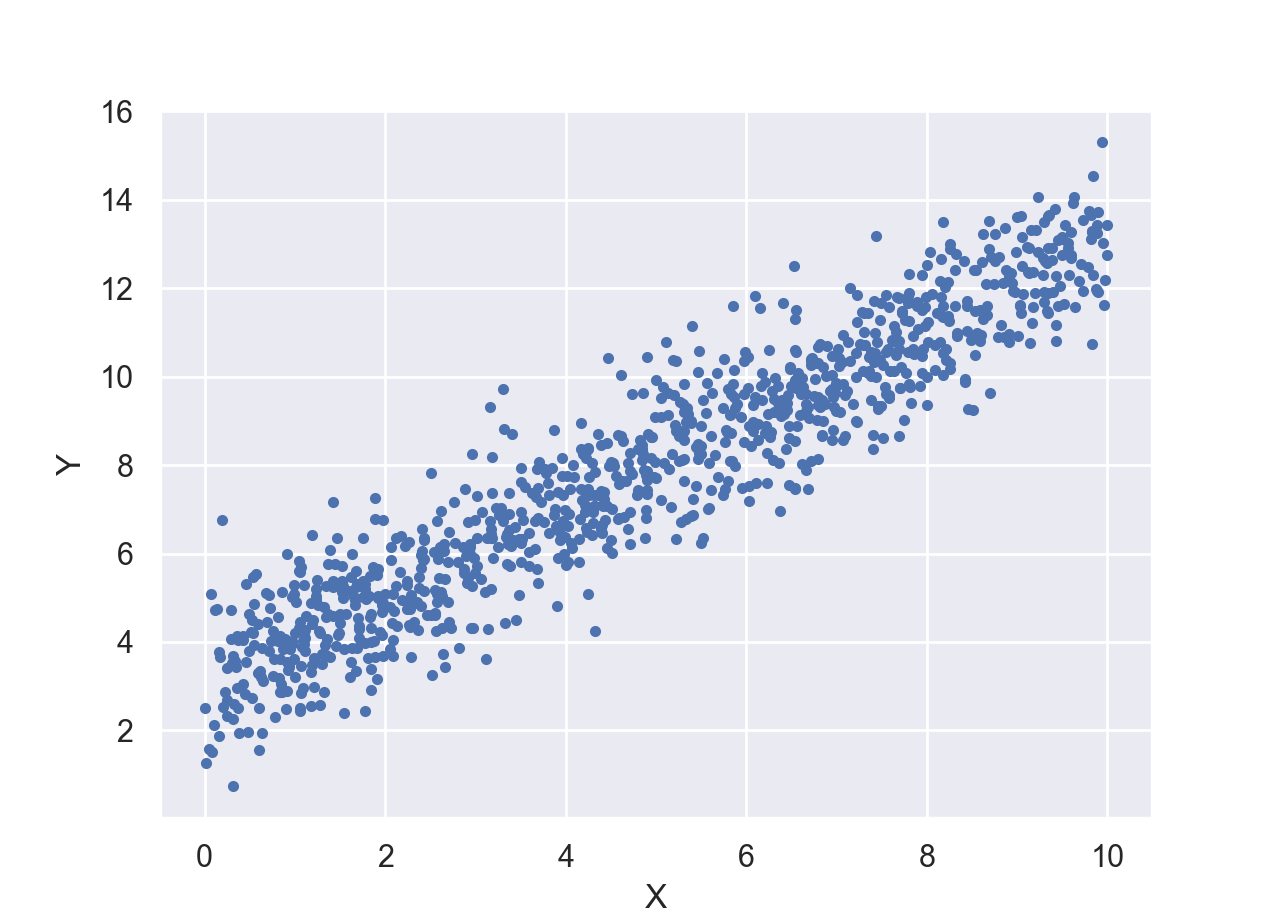
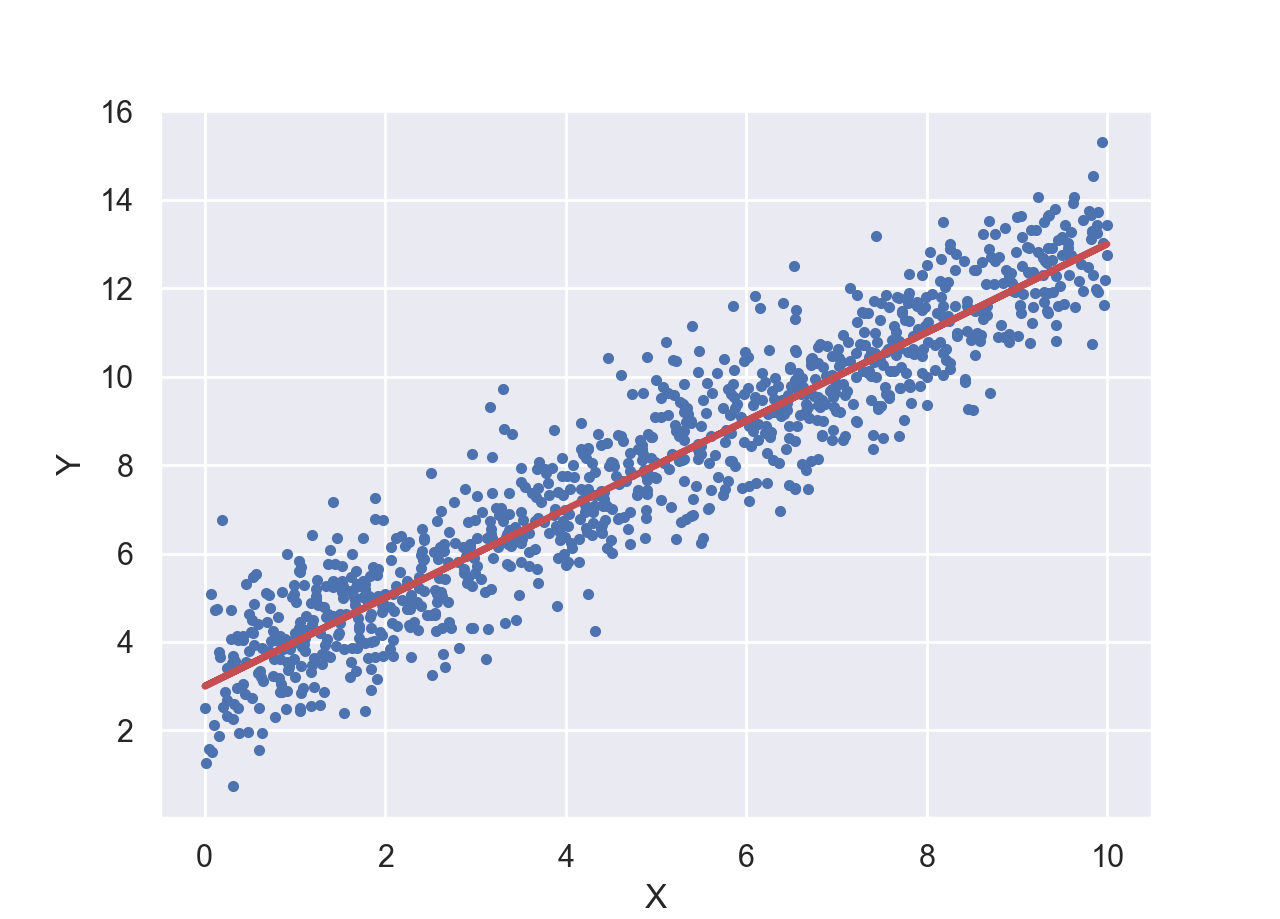
As you may have guessed, the only difference between this dataset and the previous one is that the random variable in this case depends on another deterministic variable $x$, most-likely, in the following manner, $y \sim \mathcal{N}(\mu = b \times x + a, \sigma)$. In other words, the data ($y$) still comes from a Normal distribution, but its mean depends on the corresponding value of $x$. Therefore, in this problem, we have three unknown parameters to optimize for: $(\sigma, a, b)$. Now, implement the maximum likelihood method for this problem by revising your answer to the previous problem in the above and make a plot of the best-fit line to the data, like the following.