Consider this dataset, 1880_2020.csv, which contains the global land and ocean temperature anomalies of the earth from January 1880 to June 2020 at every month. As stated in the file, temperatures are in Degrees Celsius and reported as anomalies relative to the average global land temperature of the Earth between in the year 1950.
- First, use Microsoft Excel software to plot the temperature anomalies reported in this dataset. You can divide the
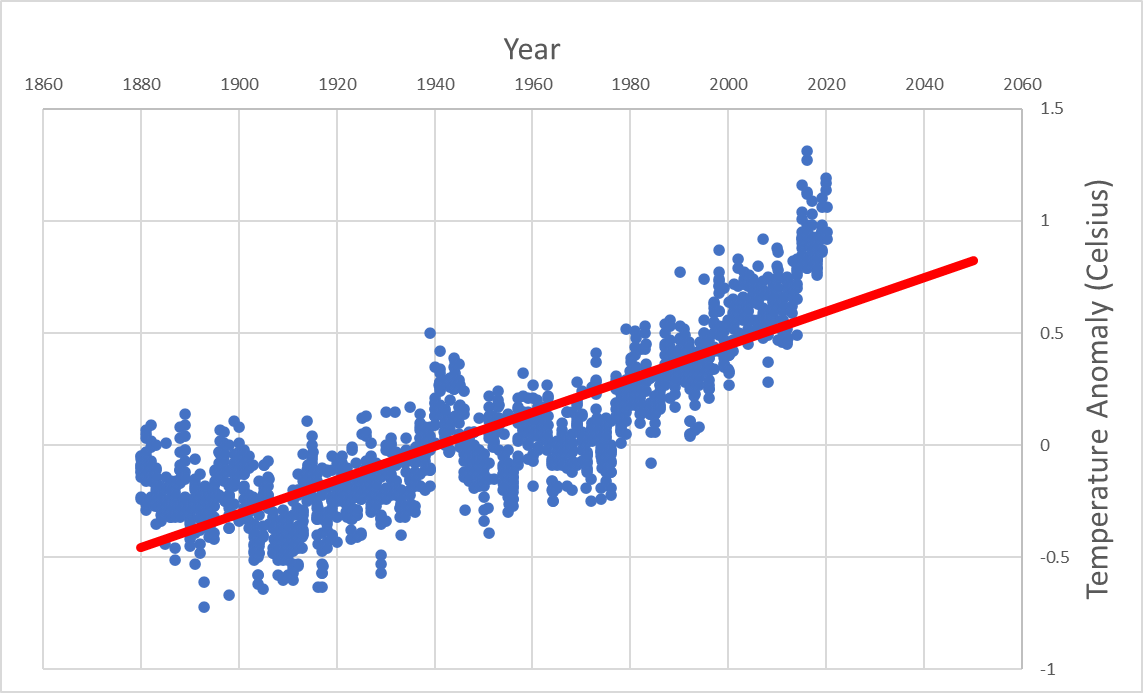
Yearcolumn of data by $100$ to obtain real years. - Fit a linear regression to temperature anomaly like the following illustration in Excel and obtain the linear regression equation. Then use the equation to predict the temperature of Earth in 2050.
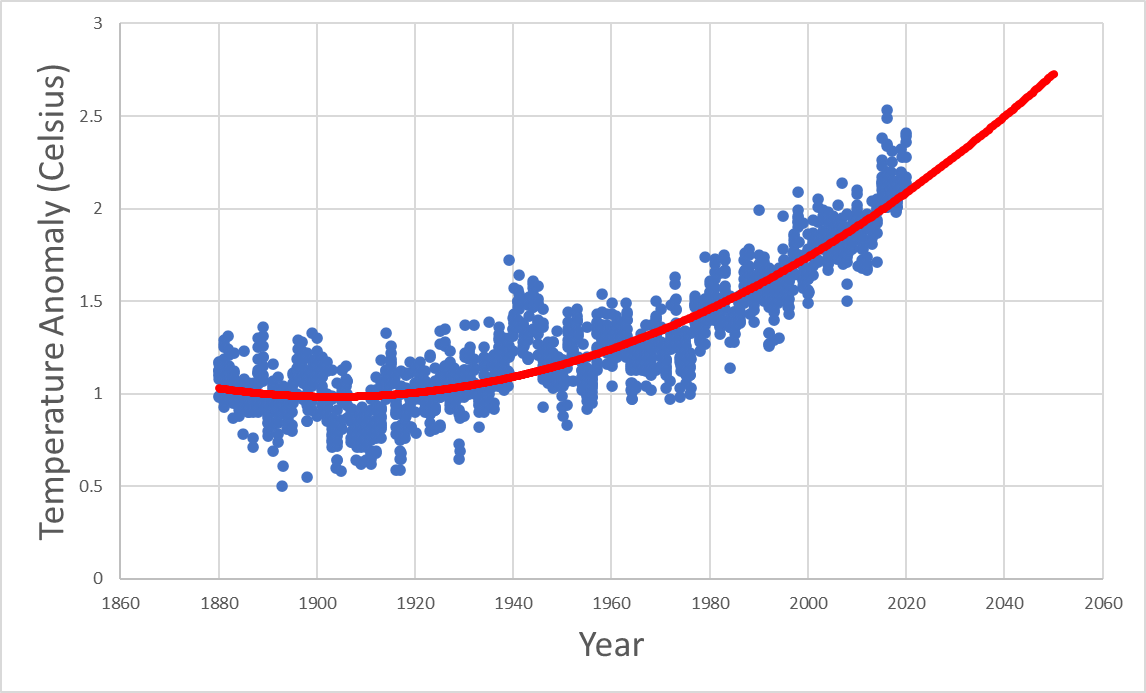
- Fit a quadratic (Polynomial of degree two) regression to temperature anomaly like the following illustration in Excel and obtain the quadratic regression equation. Then use the equation to predict the temperature of Earth in 2050.
- Which one of the mathematical models that you have fir to data is a better representation of reality? Which one predicts more temperature increase in the near future?
