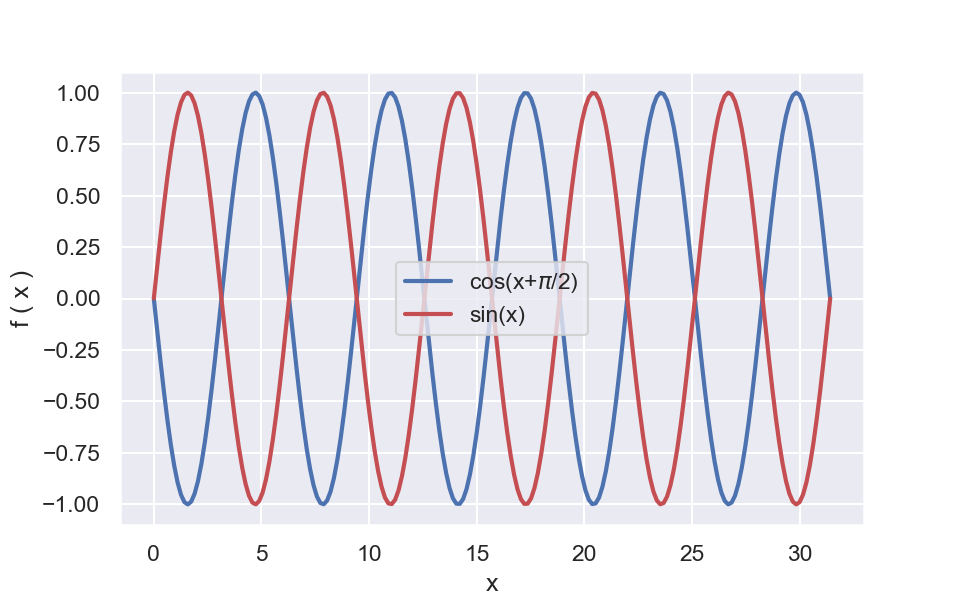
Generate two arrays corresponding to the values of $\sin(x)$ and $\cos(x+\pi/2)$ functions in the range $[0, 10\pi]$. Make a plot of the resulting arrays like the following illustration.
Now use an FFT package in the language of your choice to compute the cross-correlation between the two resulting arrays from $\sin()$ and $\cos()$. Plot the resulting cross-correlation to obtain an illustration like the following.
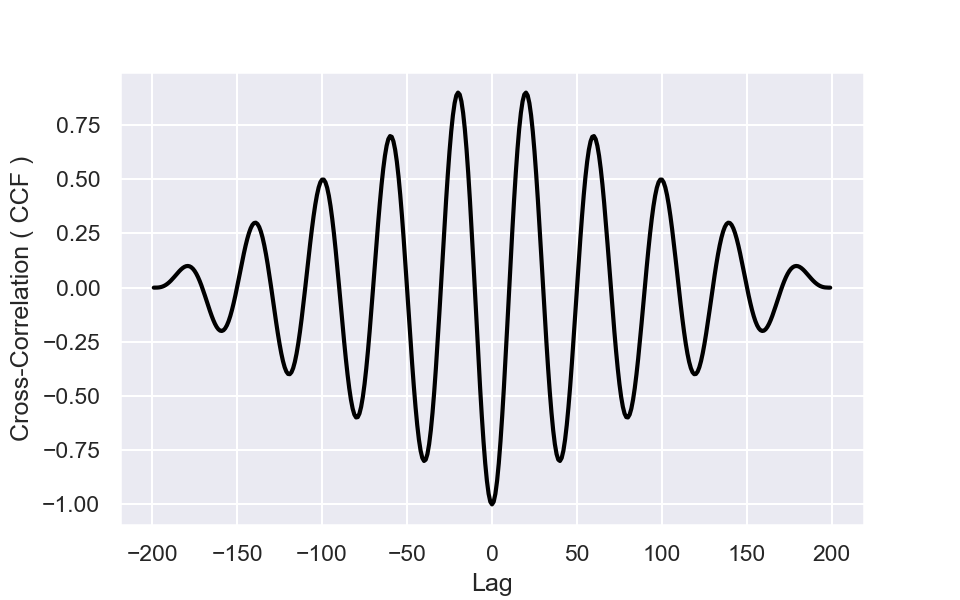
Explain the reason for the periodic behavior of the cross-correlation. Why does the periodic signal decay toward the tails?
Now compute the autocorrelation of each of the arrays separately and plot the resulting autocorrelations to compare with the CCF between the two as computed in the above. Plot the resulting autocorrelations to obtain illustrations like the following,
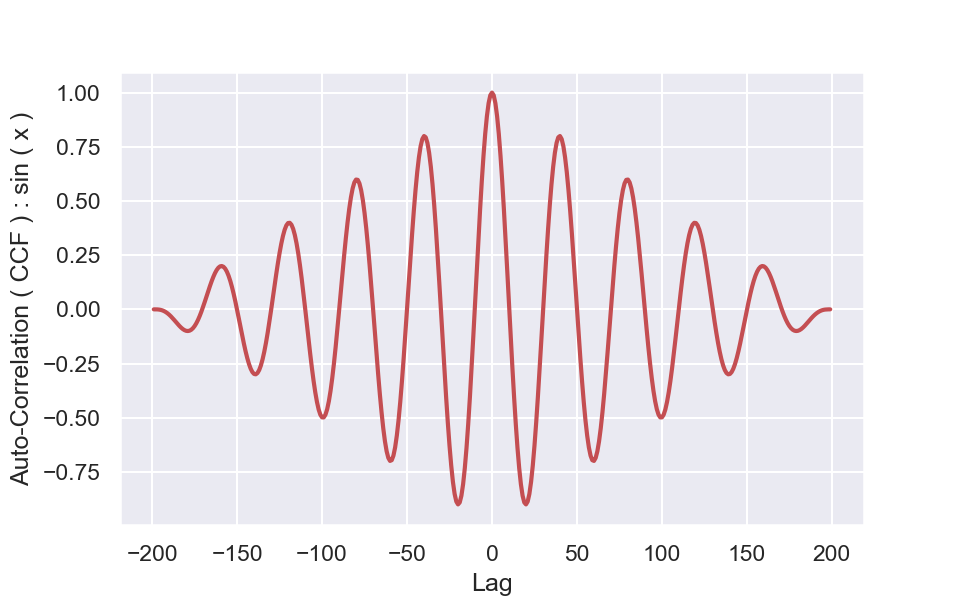
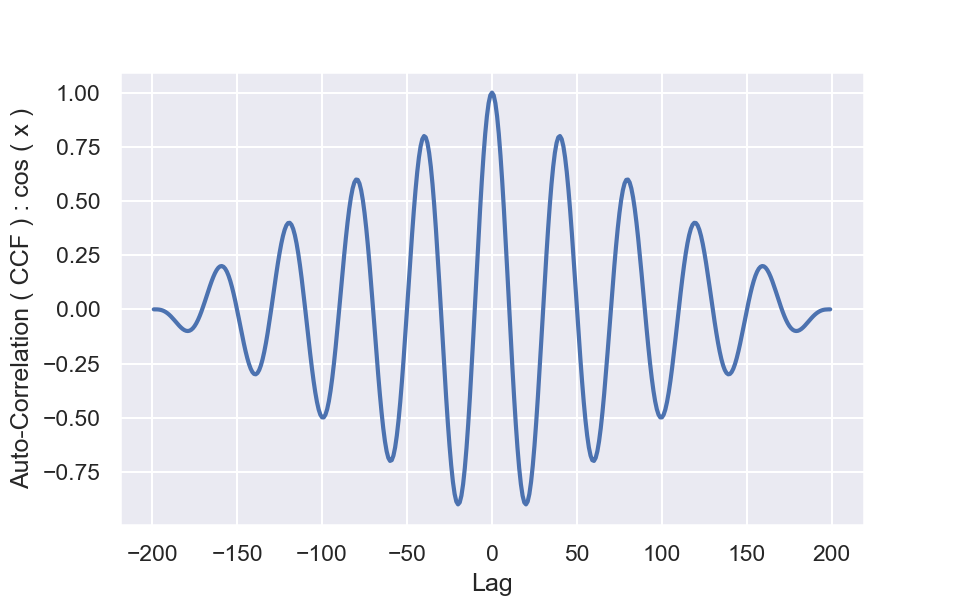
Explain why the autocorrelations of sin() and cos() are similar to each other while they look different from the cross-correlation in the above. What can you do to make the cross-correlation of sin-cos look like the autocorrelations of sin-sin and cos-cos?
