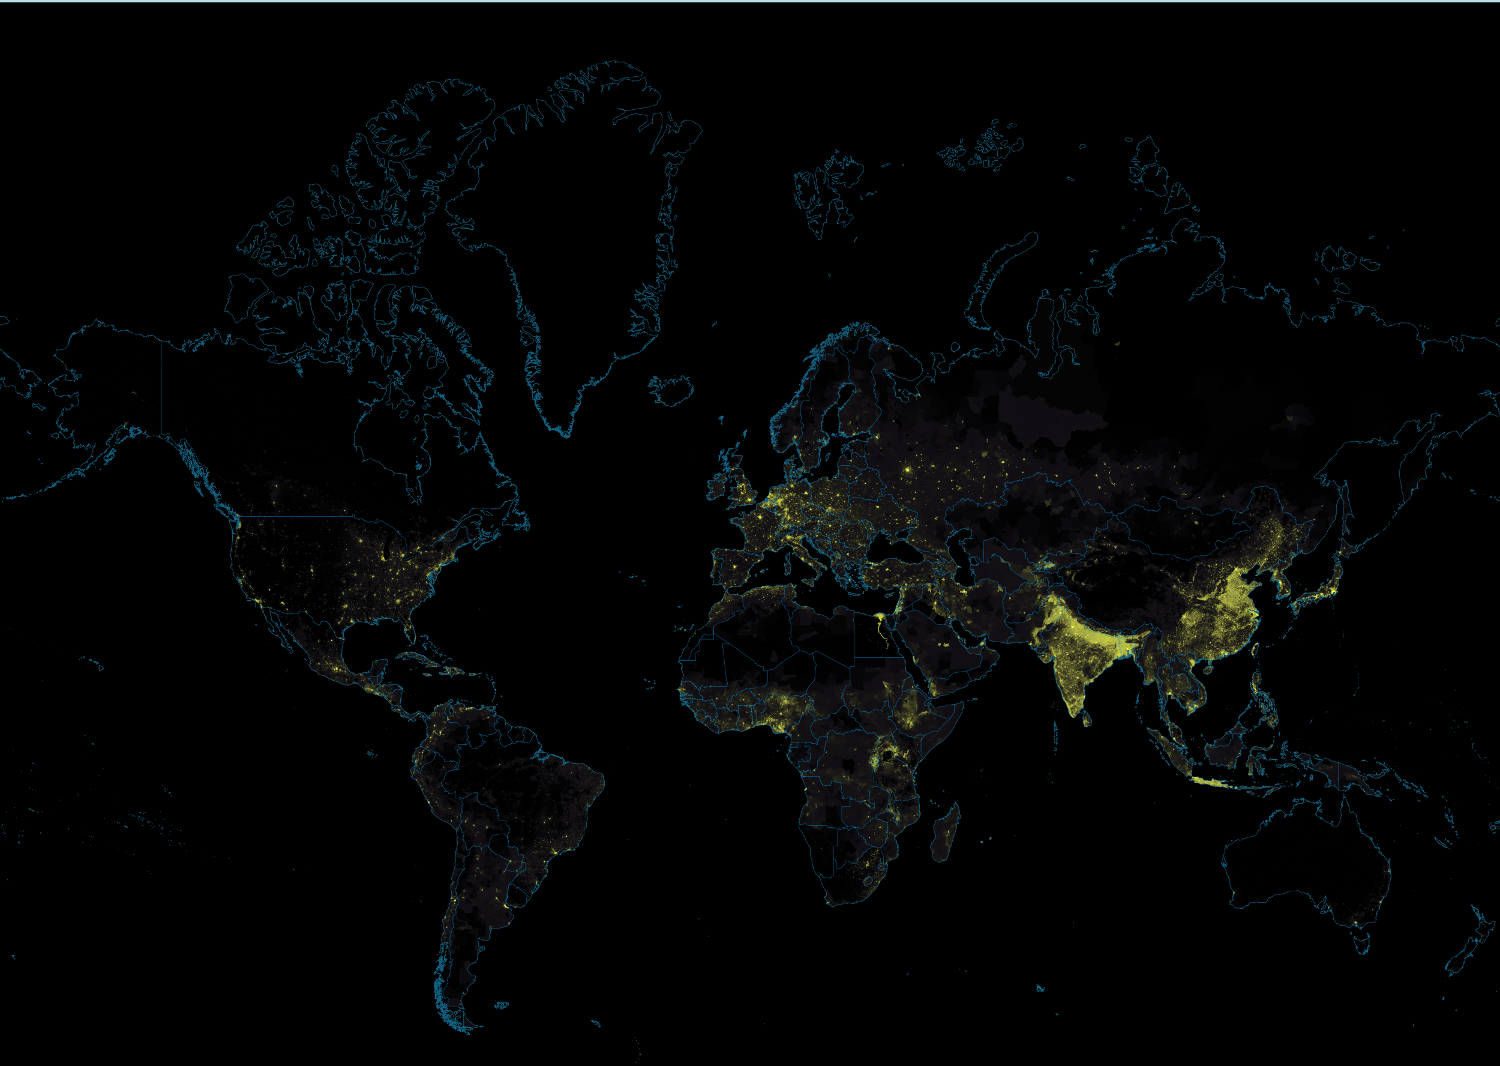
The following plot is a refined map of the worldwide population.
What kind of visualization and map is this plot? Select all that apply.
- Robinson map,
- Interrupted Goode Homolosine map,
- Cartesian Longitude and Latitude map,
- Cartogram Heat map,
- Winkel Triple map,
- Choropleth map,
- Cartogram map,
- Density map,
- Heat map.