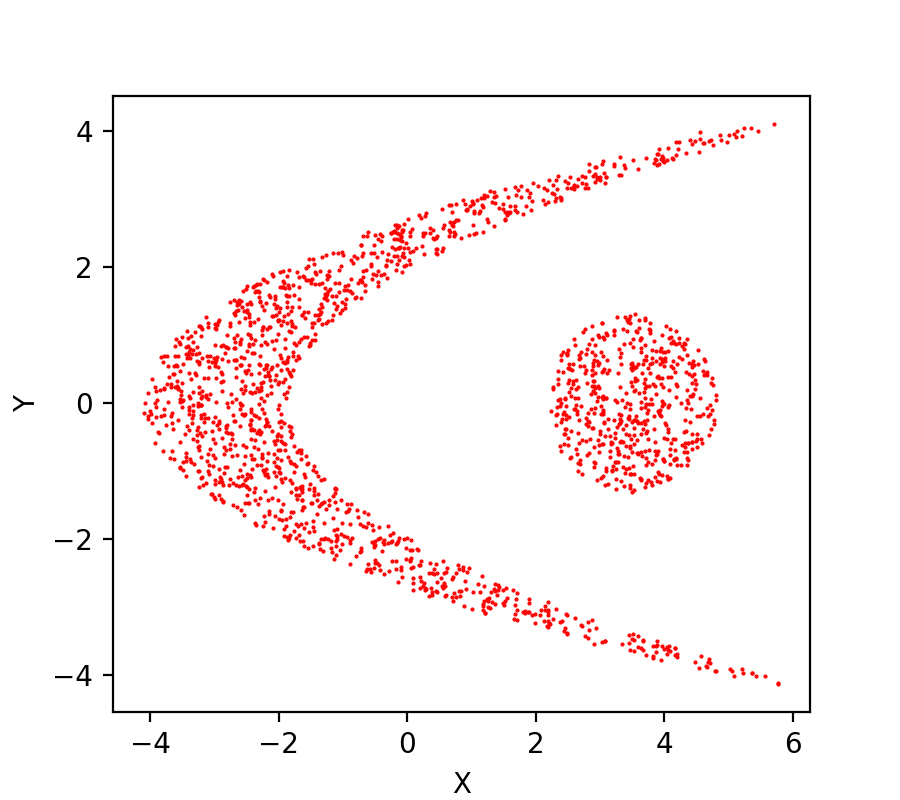
Consider this dataset points.txt. Write a script that reads this dataset and plots the second column of the dataset versus the first column as the following,
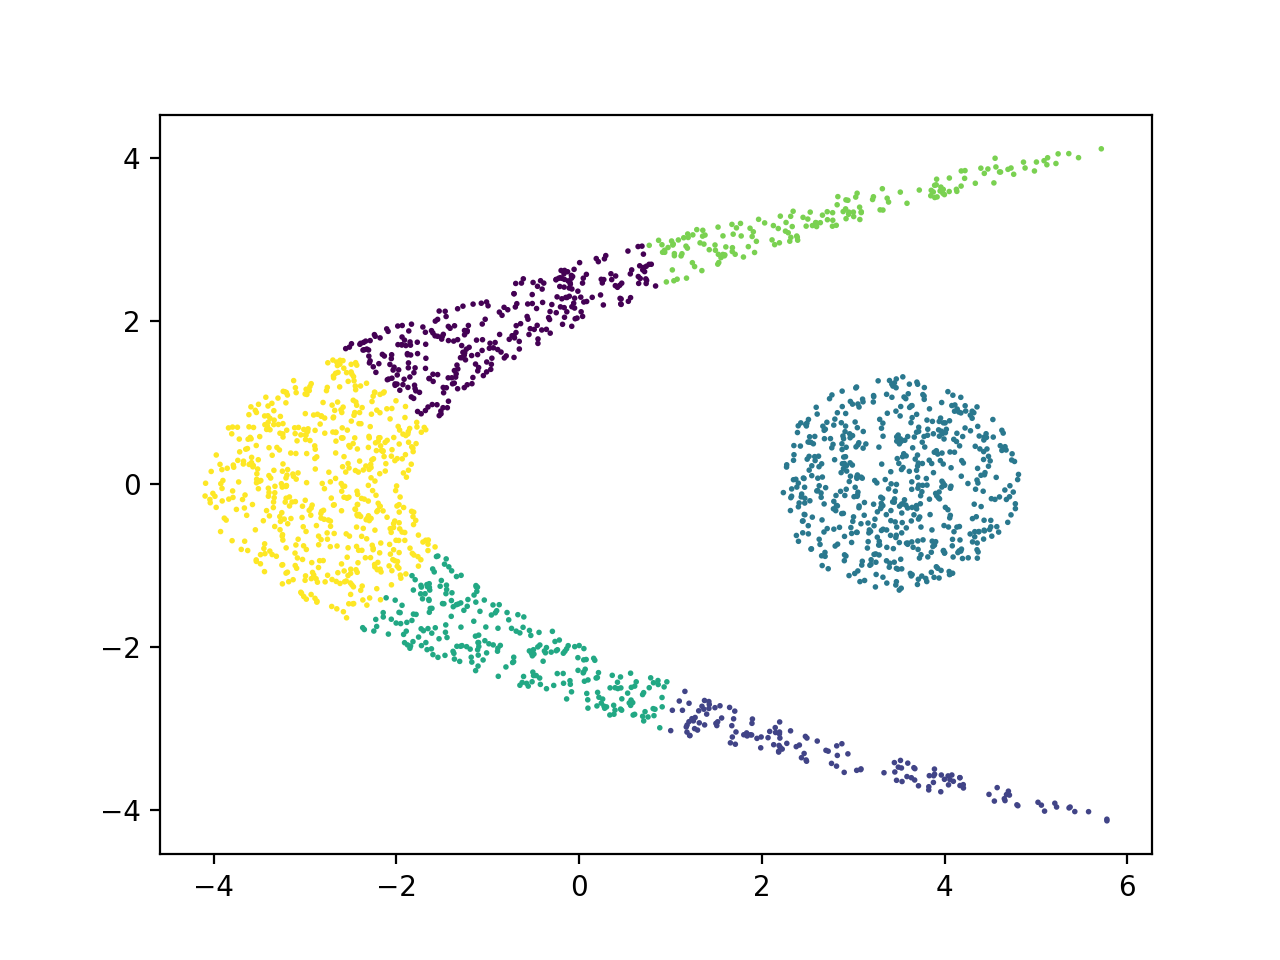
Now write another script that applies Kmeans clustering technique to this data set and plot the resulting clusters for a range of input number of clusters. Here is an example plot for a cluster count of 6.
Make an Elbow plot with the inertia of the clusterings you have done with various cluster counts.
Now, write a new algorithm implementing the Kmeans method.
- The function that you write must take a two dimensional data as input and the number of clusters to find.
- Then the function randomly initializes the centers of the clusters.
- Then it computes the distances of each point from each cluster center.
- Then it assigns each point to its nearest cluster center.
- Based on the members identified for each cluster, the function computes the new cluster centers as the averages of their member points.
- Then it compares the new centers with the old centers and if no center has changed by more than a certain threshold, it returns the memberships and the cluster centers as the clustering result. Otherwise, if at least one center has change beyond the arbitrary threshold that you have set (or the user passes to your function), then it repeats all of the above tasks from 3 to the end, until convergence occurs.
Verify the functionality of your implementation with the external package that you originally used to perform Kmeans clustering.
