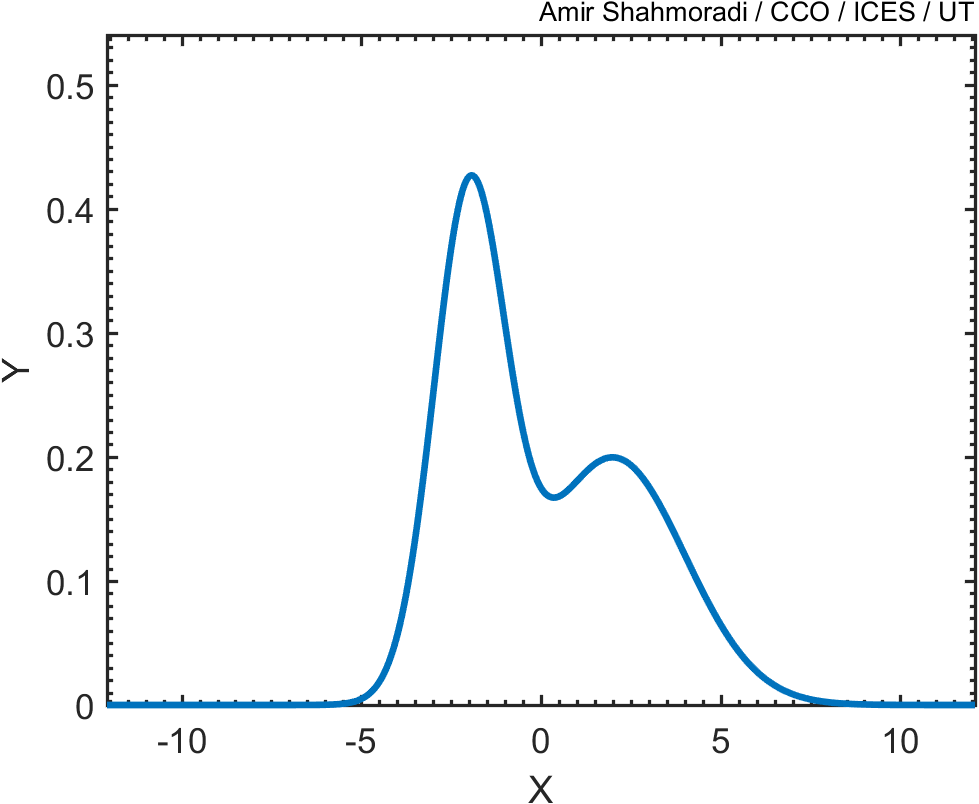
Suppose that you wanted to generate points whose distribution follows the blue curve in the following curve, whose mathematical formulation is known (in the case here, the function is just the sum of two Gaussian distributions),

The equation describing the above curve is the following,
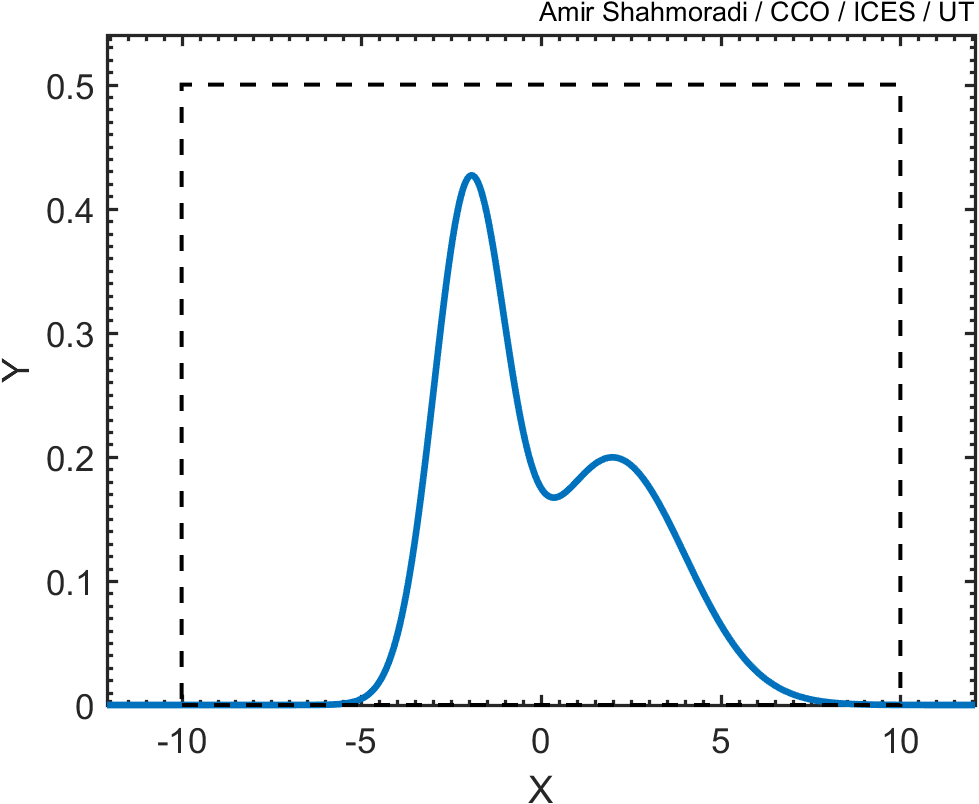
\[f(x|\mu_1,\mu_2,\sigma_1,\sigma_2) = \frac{1}{\sigma_1\sqrt{2\pi}}\exp\bigg( -\frac{(x-\mu_1)^2}{2\sigma_1^2} \bigg) + \frac{1}{\sigma_2\sqrt{2\pi}}\exp\bigg( -\frac{(x-\mu_2)^2}{2\sigma_2^2} \bigg) ~,\]with the means of the two Gaussian distributions being $[\mu_1,\mu_2]=[-2, 2]$, and standard deviations being $[\sigma_1,\sigma_2]=[1, 2]$. Now, one way of doing this is to draw a box around this curve, such that the box encompasses the entire curve.

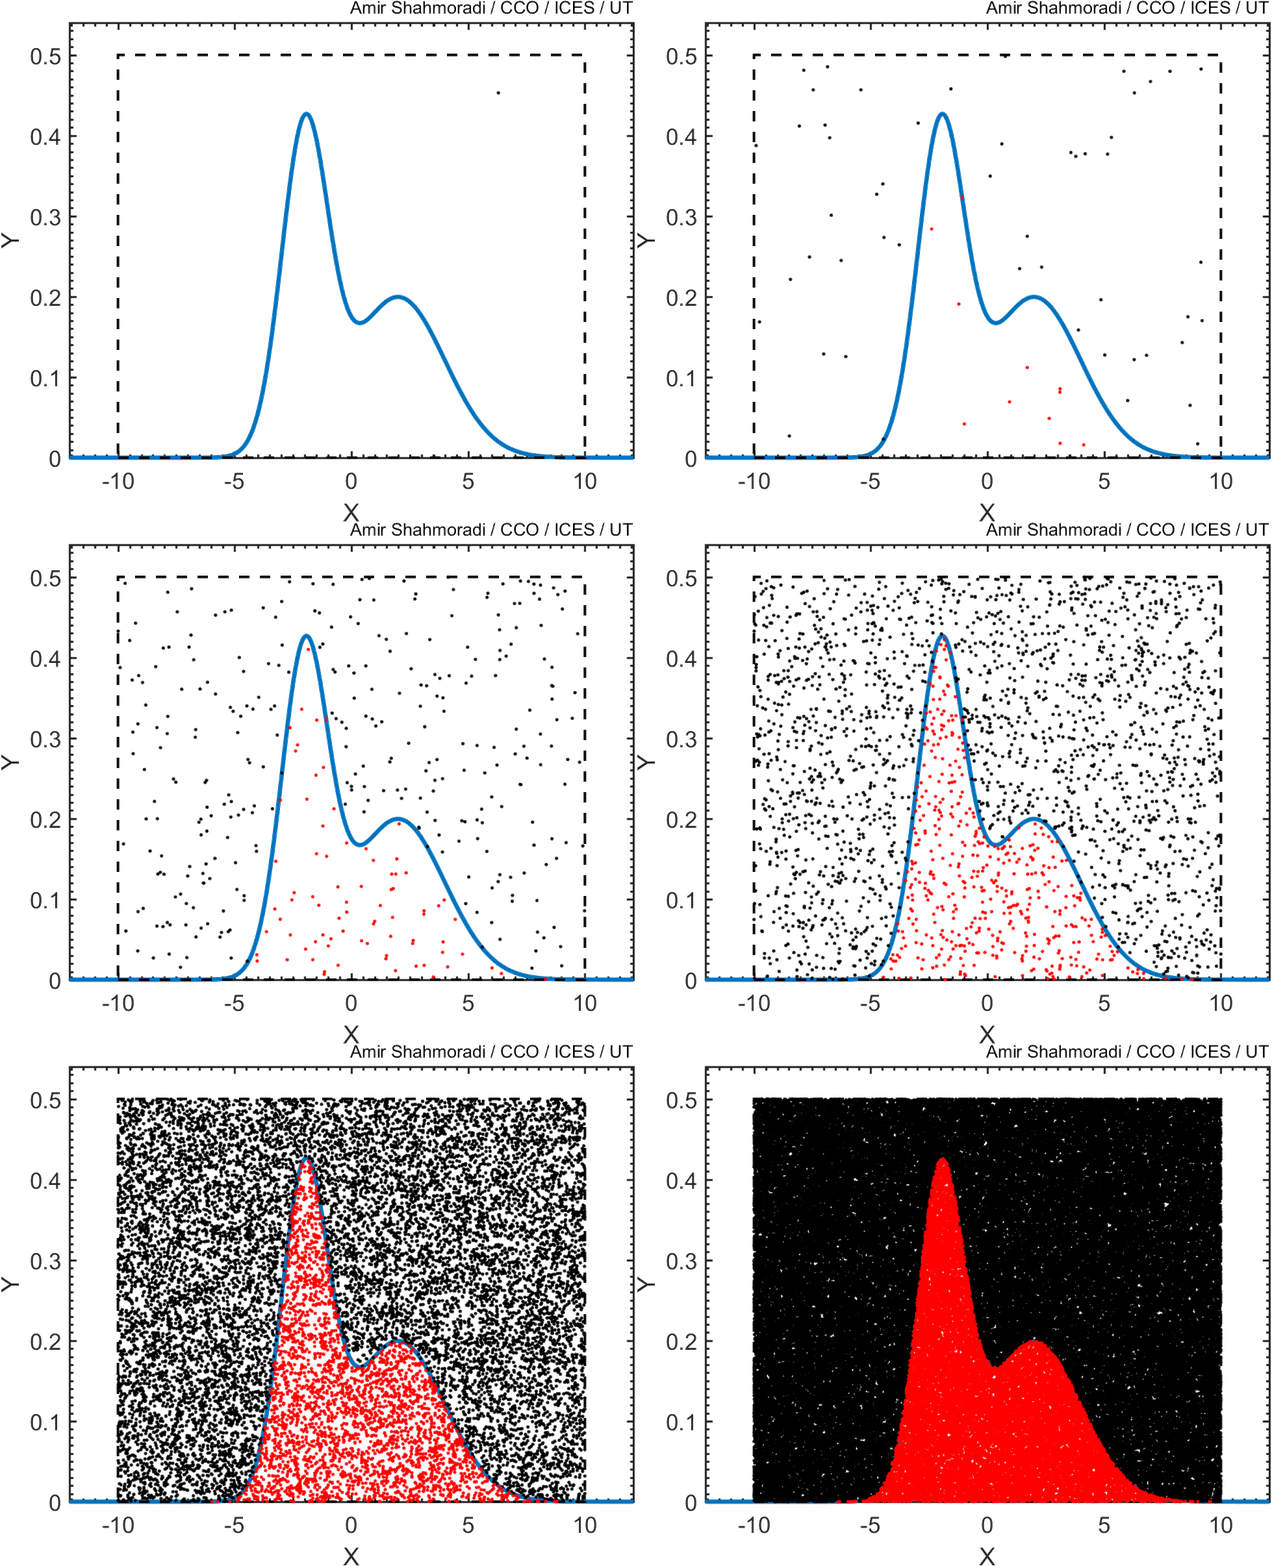
Then, we draw random points from this square and keep only those points that fall beneath this blue curve, like the red points in the following animation.

As you see, the base of this square has a width of 20, and its height is 0.5.
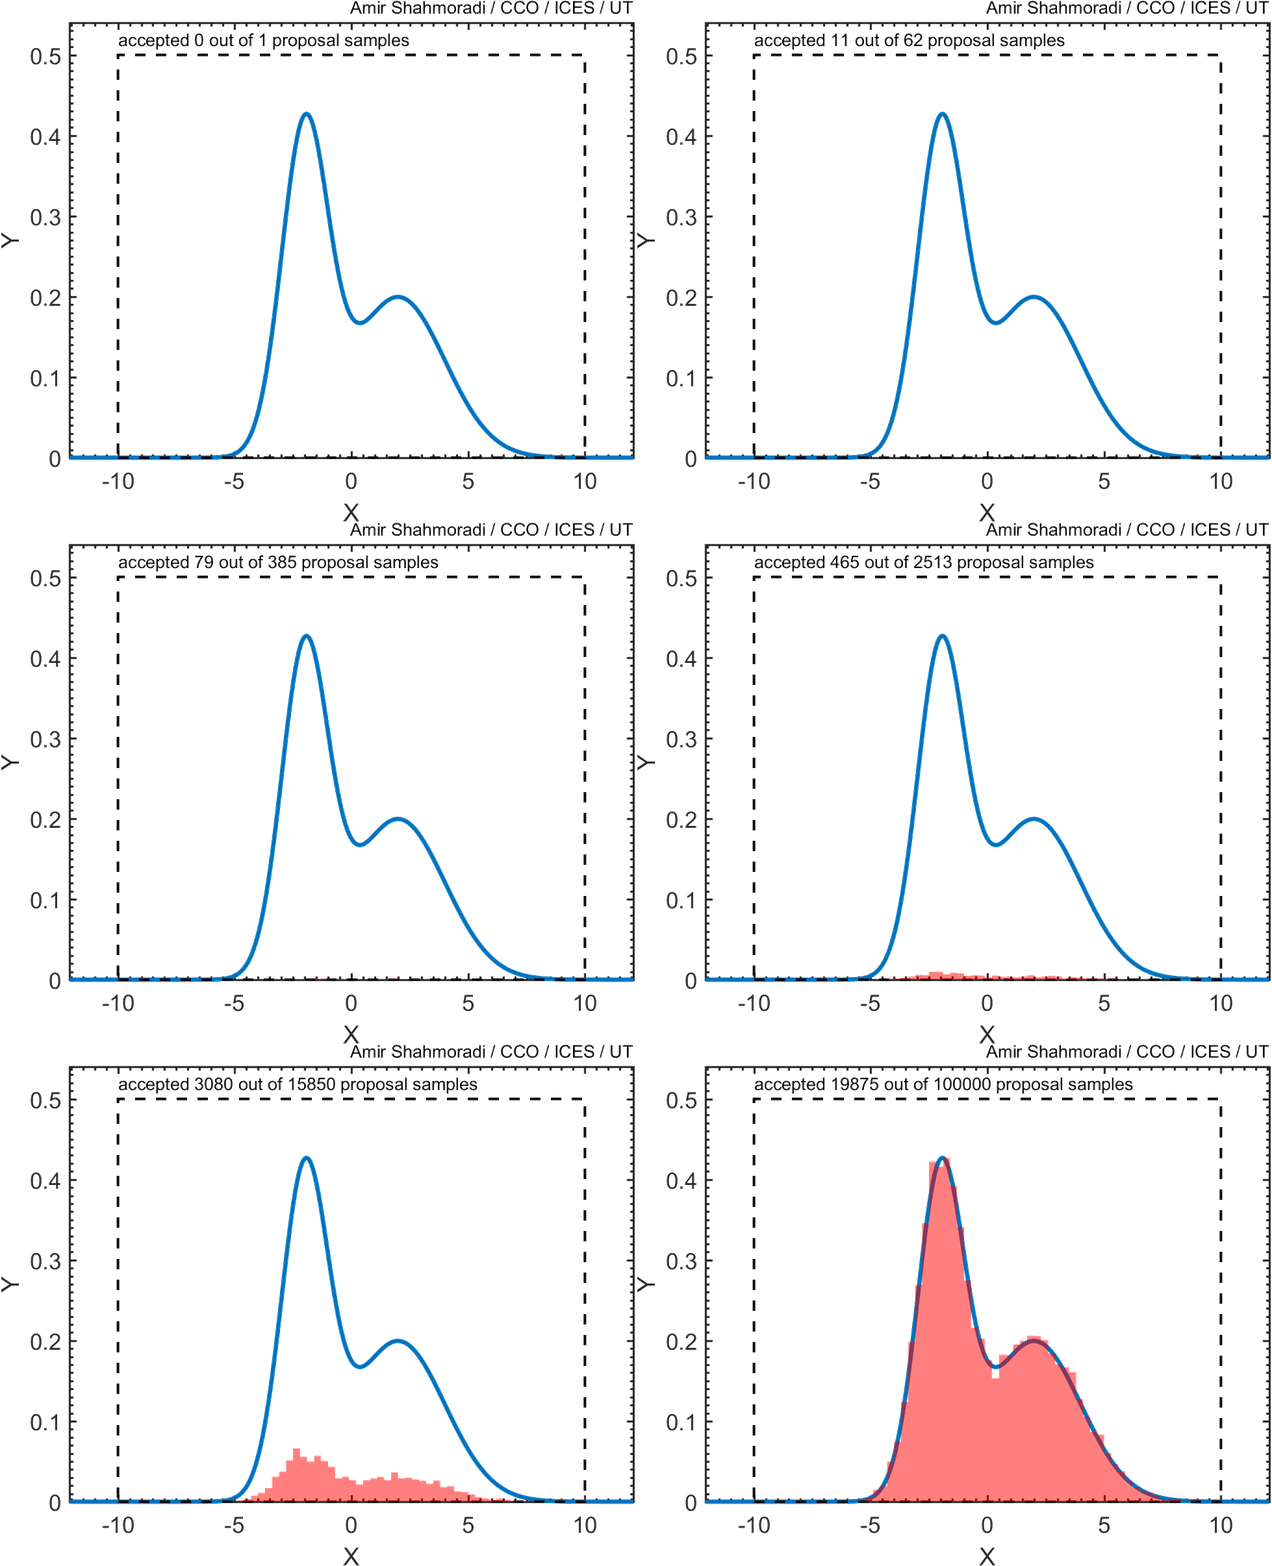
Now, if you plot the histogram of these points, you will see that the distribution of the red points follows closely the blue curve that we wanted to sample.

Now, given the above description, write a script or function that performs this Monte Carlo rejection sampling and computes the area under the two Gaussian distributions. What do you think the result of this integration should be asymptotically?

