Suppose that you wanted to generate points whose distribution follows the blue curve in the following curve, whose mathematical formulation is known (in the case here, the function is just the sum of two Gaussian distributions).
Now, one way of doing this is to draw a box around this curve, such that the box encompasses the entire curve.
Then, just as we did in the previous problem above, we draw random points from this square and keep only those points that fall beneath this blue curve, like the red points in the following animation.

Now, if you plot the histogram of these points, you will see that the distribution of the red points follows closely the blue curve that we wanted to sample.
Now, given the above example, consider the following distribution function which we want to sample,
\[f(x) = \frac{(x+1)}{12} \exp\bigg(-\frac{(x-1)^2}{2x}\bigg) ~~,~~ x > 0.\]Suppose we know already that the highest point (maximum value) of this function is $f<0.2$, so that the value of this function always remains below $0.2$ everywhere along the positive x-axis, as seen in the following figure,
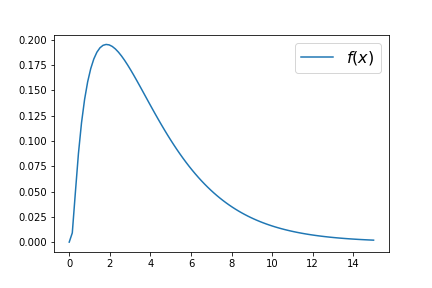
(A) Now, first write a function that generates a plot of this function, similar to the above plot.
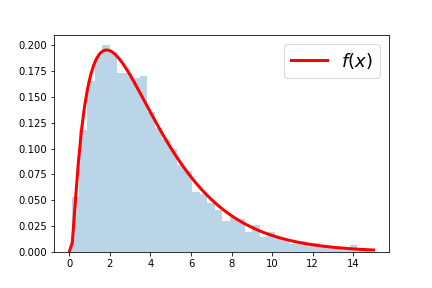
(B) Then write another script that samples from this function by first drawing a rectangle of base size $[0,15]$ and height $[0,h]$ with $h=0.2$. Then, draw uniform random points from this rectangle, and keep those that fall beneath the value of $f(x)$ given above as points that are sampled from this function. Finally, make a histogram of these points like the following.
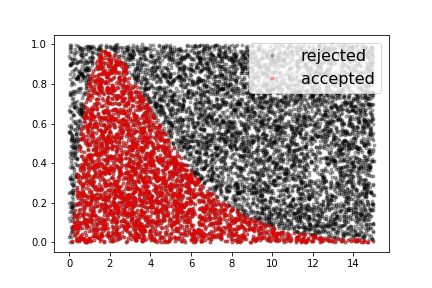
(C) Now make a plot of all generated points, both those that were accepted as samples, and those that were rejected, similar to the following plot, with accepted points in red color, and rejected points in black,