Consider this dataset, 1880_2020.csv, which contains the global land and ocean temperature anomalies of the earth from January 1880 to June 2020 at every month. As stated in the file, temperatures are in Degrees Celsius and reported as anomalies relative to the average global land temperature of the Earth between in the year 1950.
First, plot the temperature anomalies reported in this dataset to obtain the following figure,
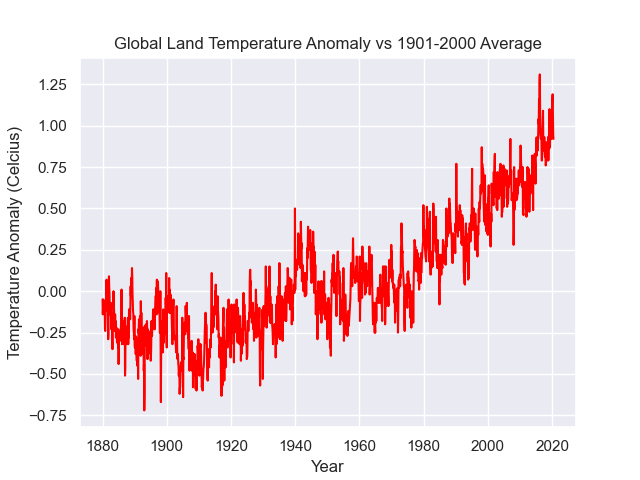
Clearly, one can see that the global land and sea temperature of the Earth starts to increase consistently over the entire 20th century and beyond (actually, if you look closely, you will notice a bump in the global temperature at around 1950, which can be attributed to the slow-down of the world’s economy during the second world-war). The around 1970, it seems like the pace of global temperature-increase significantly accelerated compared to the past.
Knowing this, we want to use the data after 1980, up until the most recent recorded temperature in 2020 in this file, to predict what the temperature anomaly of the Earth in the year 2050 will be. By looking at the above plot, it seems plausible that a simple linear regression will give us a good first approximation of the temperature anomaly in 2050. Write a script that fits a line to the temperature data used above from about the year 1980 (data point 1200 in the file) to 2020 (the last data point in the file) and find the parameters of this fit. Then use this fitted line to predict the temperature anomaly of the Earth in 2050. The result of the fitting should be something like the following,
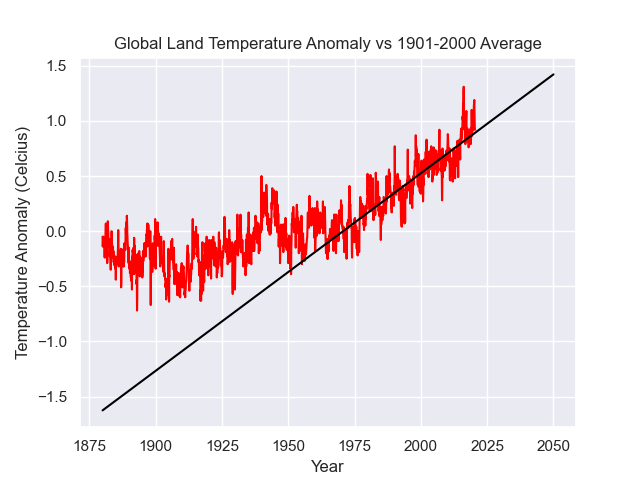
where the red line represents the linear-fit to the temperature anomaly data from 1970-2013, and then extrapolates to the temperature anomaly to the year 2050. Interestingly, the predicted temperature-anomaly at year 2050 ($1.9158$) is very close to what the climate scientists have been talking about, for a long time.
Next, we want to perform an exponential fit to the dataset. Taking the year 1950 as the reference zeroth point, we can perform the exponential fit using the least-squares method to obtain the following fit,
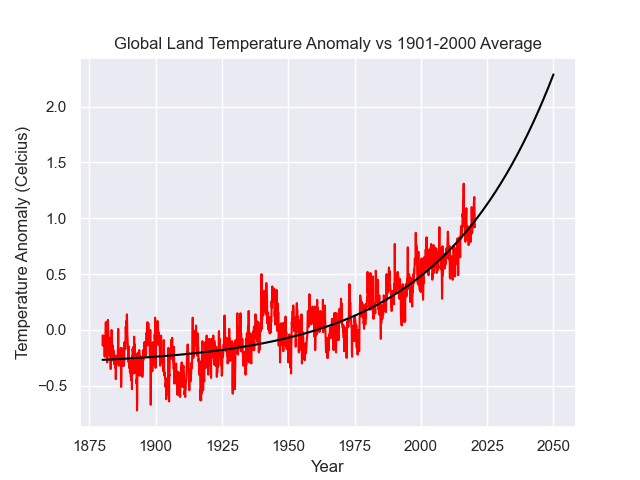
Now write a script that does this fitting and compare the predicted values for the temperature anomaly of the earth as predicted by the linear and exponential fits. Which one do you believe more?
