Consider this dataset, usaTemperatureHistory.txt, which contains the global land temperature of the earth from 1743 to 2013 at every monthly resolution. As stated in the file, temperatures are in Celsius and reported as anomalies relative to the average global land temperature of the Earth between Jan 1951 to Dec 1980.
First, plot the data contained in the third column of this file (the Monthly Anomaly column starting with $-1.131$) against the year and month of the corresponding row in the file. Note that the year and month of the temperature anomaly are given separately in the first two columns. Therefore, to include all of the months of a given year correctly and consistently on a single plot, you will need to define a new value for the x-axis of the plot, where $x$ represents the year plus the month of the record times $1/13$,
\[x = \rm{year} + \rm{month} / 13 ~~,\]Note that you will have to write your code in such a way to remove the first 70 lines of text in the file to reach to the data section. The resulting plot should look something like the following,
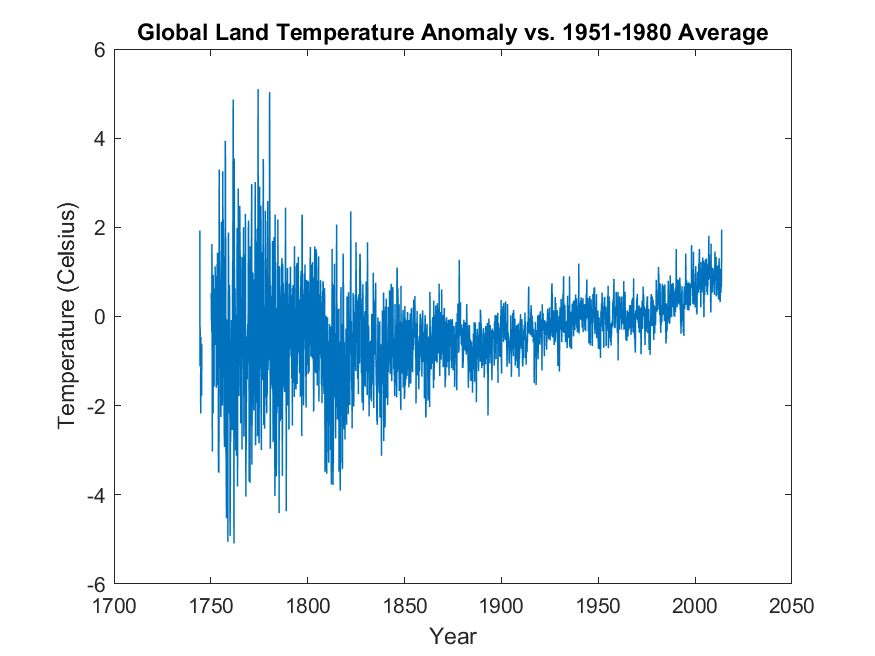
Clearly, one can see that the global land temperature of the Earth was relatively constant up until around 1880. Afterwards, the global temperature starts to increase consistently over the entire 20th century and beyond (actually, if you look closely, you will notice a bump in the global temperature at around 1950, which can be attributed to the slow-down of the world’s economy during the second world-war). The around 1970, it seems like the pace of global temperature-increase significantly accelerated compared to the past.
Knowing this, we want to use the data after 1970, up until the most recent recorded temperature in 2013 in this file, to predict what the temperature anomaly of the Earth in the year 2050 will be. By looking at the above plot, it seems plausible that a simple linear regression will give us a good first approximation of the temperature anomaly in 2050. Write a script that fits a line to the temperature data used above from the year 1970 to 2013 and find the parameters of this fit. Then use this fitted line to predict the temperature anomaly of the Earth in 2050. The result of the fitting should be something like the following,
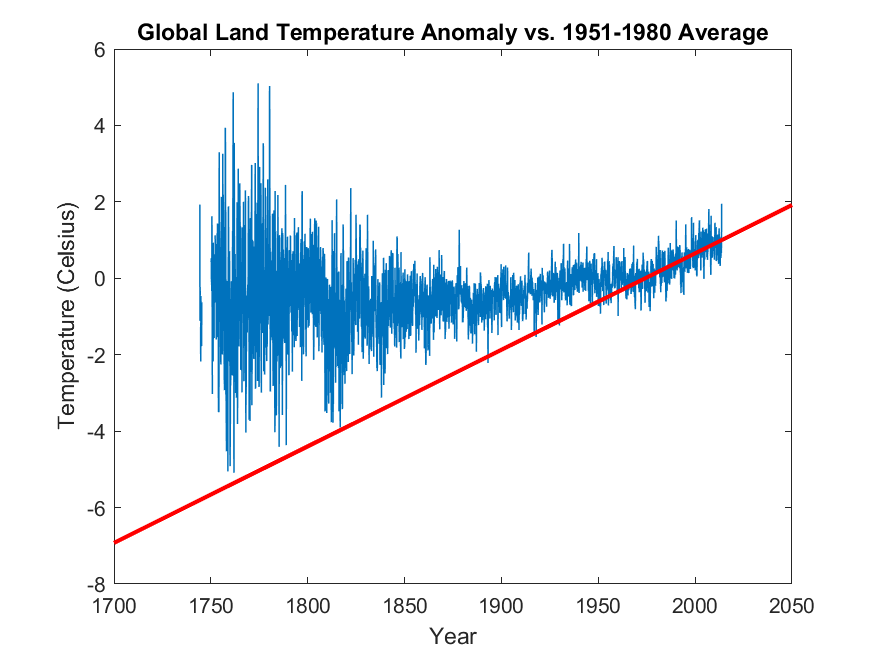
where the red line represents the linear-fit to the temperature anomaly data from 1970-2013, and then extrapolates to the temperature anomaly to the year 2050. Interestingly, the predicted temperature-anomaly at year 2050 ($1.9158$) is very close to what the climate scientists have been talking about, for a long time.
