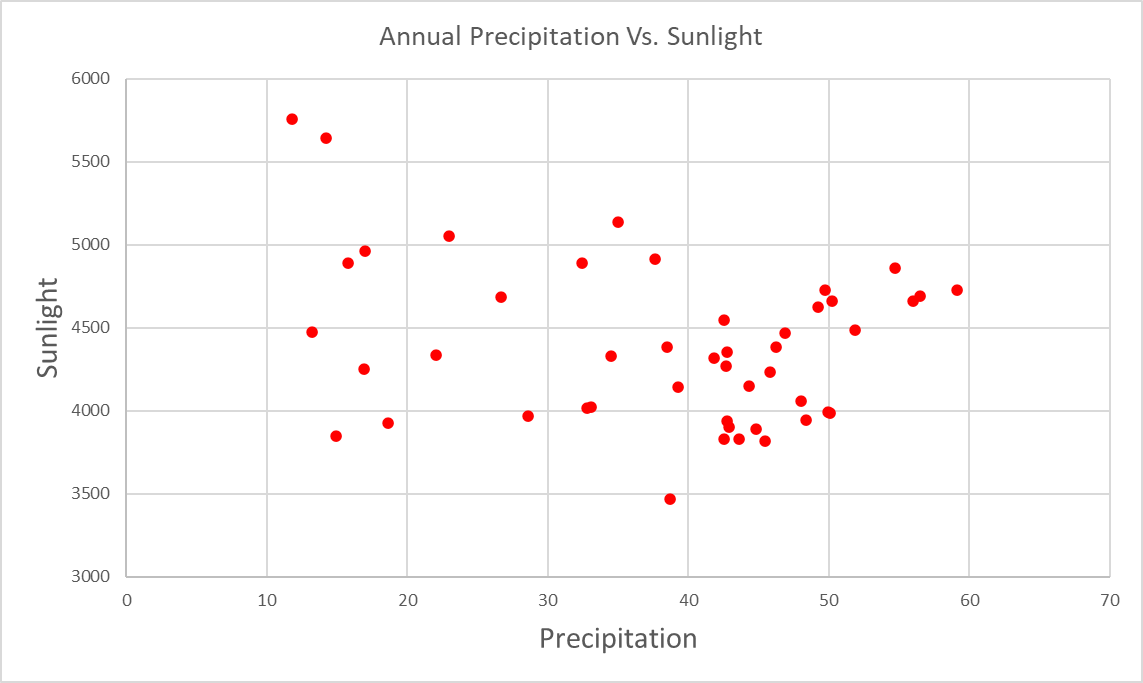
Consider the following dataset containing the average annual precipitation in the US states between 1971-2000 and this dataset. Combine these two datasets in Excel and generate a plot of US states precipitation vs. sunshine like the following figure. Note that you will have to adjust the data in the two file to remove a number of states that do not exist in both datasets.